Creating Report in Business Intelligence Development Studio (BIDs) with Analysis Services Cube in TFS 2010
Posted by: Gouri Sohoni ,
on 7/14/2010,
in
Category VSTS & TFS (Azure DevOps)
Abstract: In this article, we will see how a report can be created with the help of Business Intelligence Development Studio (using Microsoft SQL Server 2008) by taking data source as Analysis Services Cube.
In order to create reports, it is essential that we first decide which data source is to be used. We can create reports based on work item query results, relational warehouse database or analysis services cube. For all these data sources, we also have different tools like Microsoft Excel, Report Designer (using Business Intelligence Development Studio) or Report Builder (a tool provided for ad-hoc reporting). If we are working on query results of work item, then we can only create a report with Microsoft Excel, as the query result is not supported in Report Designer or Report Builder. With Excel we can also create a report on OLAP cube by connecting to analysis services database.
Analysis services database is a multidimensional database which has aggregates computed from warehouse database. The data is stored in cube which contains measures against various dimensions. The values are stored in aggregated form in cube.
If you have installed SQL Server Enterprise Edition for Visual Studio then you will see various perspectives along with the cube named `Team System’. There are perspectives named Build, Code Churn, Code Coverage, Test, and Work Item.
The different measure groups for the cube can be seen from the figure below.
In the screenshot below, we see the list of different dimensions
With the cube named ‘Team system’ there are various measure groups and dimensions which will have hierarchies in them. The ‘Fact’ tables from the cube will have relationship with different dimensions as can be seen from the following figure in which only a part with Code Churn and related dimensions is shown.
Normally fact tables contain numeric data and dimensions contain axes on which slice or dice of data can be made. Generally we have primary keys in dimension tables which are related to foreign keys from fact table thus giving us a particular view when required. Fact tables will usually have a large number of rows (as they are having historical data stored). Measures are referred to the numeric fields from the fact table which can be summarized. Each warehouse can have one or more fact tables which can be categorized in `star’ or `snowflake’ schema.
Let us discuss how to create a report using Business Intelligence Development Studio (BIDs) based on analysis services cube from database Tfs_Analysis.
Step 1: Start BIDs and create or open the template for report project.
Step 2: Create a shared data source which points to Analysis Services database named Tfs_Analysis
Step 3: Add a new report and in query designer, select Lines added, modified and deleted from Code Churn measure. Select ‘Checked In By’ from Version Control Changeset dimension.
Step 4: Specify all the fields in ‘Details’ and select the table style.
Step 5: Provide name for the report and click the check box for Preview Report.
Create Report on Analysis Services Cube using Microsoft Excel
Similarly report on analysis services cube can be created using Microsoft Excel. Follow these steps:
Step 1: In a workbook, click on the Data tab and select ‘From Other Data Sources’ followed by ‘From Analysis Services’
Step 2: Enter the server name and specify the authentication as Windows
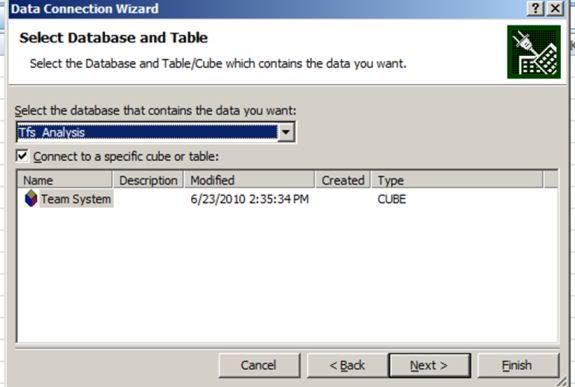
Step 3: Select database as Tfs_analysis as shown
Step 4: Connection string gets stored in a file with extension ‘odc’
Step 5: Specify the type of report to be created as PivotTable or PivotChart with PivotTable and click ok after giving worksheet and the cell address
Step 6: Now we can select the pivot table fields from the right hand side filed list, specify row labels, column labels, values and filter if any.
Step 7: That’s it. In following report shown below, it shows a calculated member named Rolling Average over various months.
Conclusion
In this article we discussed different report authoring tools and particularly how to create a report using Report Designer based on Analysis Services Cube.
This article has been editorially reviewed by Suprotim Agarwal.
C# and .NET have been around for a very long time, but their constant growth means there’s always more to learn.
We at DotNetCurry are very excited to announce The Absolutely Awesome Book on C# and .NET. This is a 500 pages concise technical eBook available in PDF, ePub (iPad), and Mobi (Kindle).
Organized around concepts, this Book aims to provide a concise, yet solid foundation in C# and .NET, covering C# 6.0, C# 7.0 and .NET Core, with chapters on the latest .NET Core 3.0, .NET Standard and C# 8.0 (final release) too. Use these concepts to deepen your existing knowledge of C# and .NET, to have a solid grasp of the latest in C# and .NET OR to crack your next .NET Interview.
Click here to Explore the Table of Contents or Download Sample Chapters!
Was this article worth reading? Share it with fellow developers too. Thanks!
Gouri is a Trainer and Consultant on Azure DevOps and Azure Development. She has an experience of three decades in software training and consulting. She is a graduate from Pune University and PGDCA from Pune University. Gouri is a Microsoft Most Valuable Professional (MVP) - Developer Technologies (Azure DevOps), Microsoft Certified Trainer (MCT) and a Microsoft Certified Azure DevOps Engineer Expert. She has conducted over 150 corporate trainings on various Microsoft technologies. She is a speaker with Pune User Group and has conducted sessions on Azure DevOps, SQL Server Business Intelligence and Mobile Application Development. Gouri has written more than 75 articles on Azure DevOps, TFS, SQL Server Business Intelligence and SQL Azure which are published on
www.sqlservercurry.com and
www.dotnetcurry.com. You can connect with her on
LinkedIn.