Being able to draw graphics and objects in the web browser is something that has become a common phenomenon in today's web landscape. As web developers working on Line of Business applications (LOB), we are often faced with the task of visually representing huge volumes on data. Luckily for us, we have a variety of visualization solutions at our fingertips which provide an excellent foundation to realize our imagination. Some of these solutions even allow us to create advanced custom graphics.
Raphaël is an open source, small JavaScript library that uses SVG and Vector Markup Language (VML) to draw vector graphics in the browser. It takes away the pain of dealing with SVG and VML and with cross-browser consistencies. Although SVG was inspired from VML, they could not co-exist on the same browser. Raphael.js makes this arduous task possible. Raphael acts as an adapter to the SVG and VML specifications and can be run in almost any browser out there. Since it outputs vector graphics, it can scale to any level without losing quality. Raster graphics on the other hand, are pixel-based and are constrained to a particular resolution, which means if they are scaled up, they lose quality leading to distorted images.
Raphael provides a set of libraries using which we can create charts and even extend them. Since Raphael uses SVG, any graphical object created by it is a DOM element, which means we can attach client-side event handlers to it using JavaScript and manipulate these elements on-the-fly. To create some awesome charts, we need to use gRaphael, a library which is based on Raphael. The API reference of gRaphael can be obtained from this link.
Editorial Note: Apart from SVG, you must have also heard about WebGL and HTML5 Canvas. While SVG is mostly used for drawing 2D vectors, HTML5 Canvas is used for bitmaps and WebGL is usually used for 3D graphics. Here is one example of creating chart using SVG in HTML 5.
Raphael, ASP.NET MVC, Entity Framework and ASP.NET Web API
Today, we will use Raphael.js in an ASP.NET MVC application with ADO.NET Entity Framework and ASP.NET WEB API. The WEB API will read data from database and expose it to the View. The view will contain the necessary Raphael references to create charts. We will be using the Northwind database. This database can be downloaded from the following link: https://northwinddatabase.codeplex.com/
We will be using Customers and Orders table for creating our Charts.
Step 1: Open the free Visual Studio Community Edition and create a new empty MVC application. Name this application as ‘Raphael_Chart’. In this project, in the Models folder add an ADO.NET Entity Data Model. Name this NorthwindEF.edmx. In the wizard for EF, select the Northwind database and select Customers and Order Table.
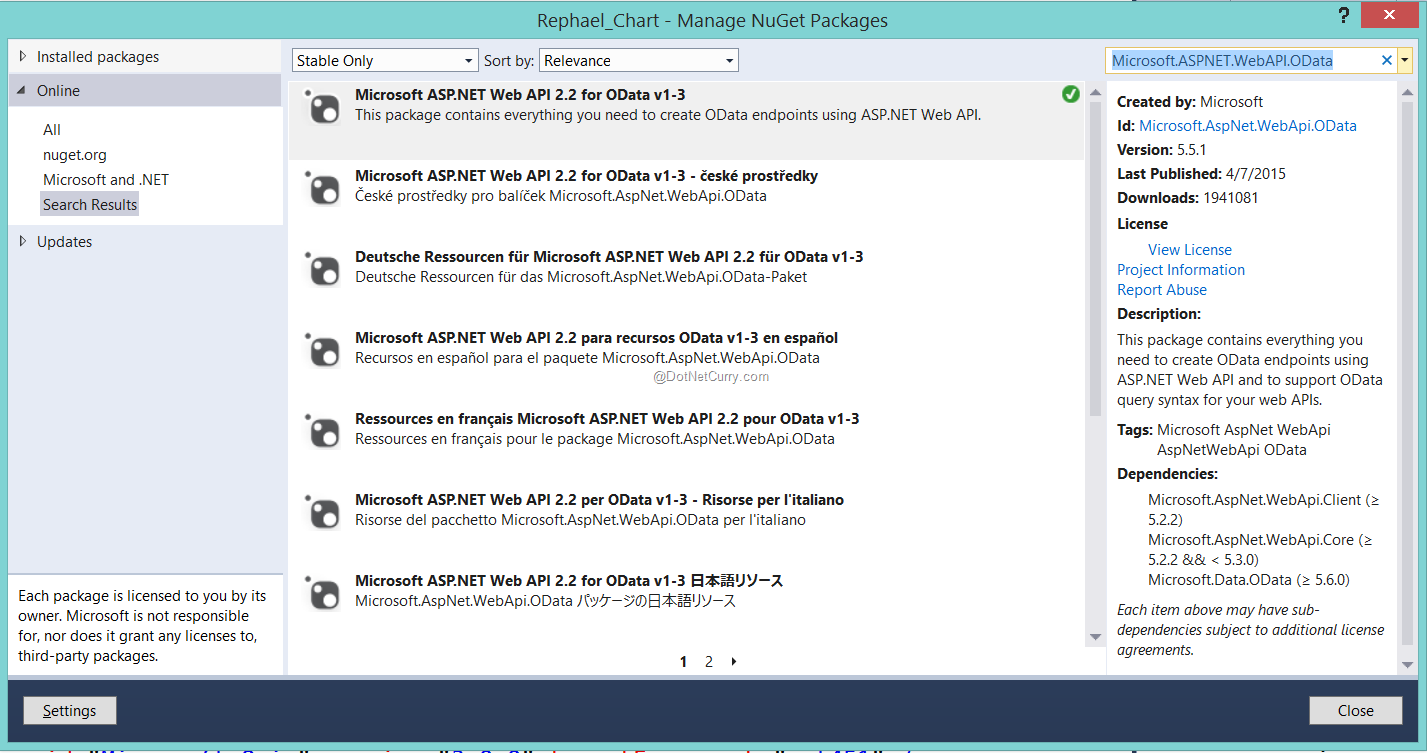
Step 2: Since we will be using WEB API for accessing the data using JSON pagination queries, we need to support [Queryable] attribute for the GET method to retrieve data. To implement this, we need to add the Microsoft ASP.NET Web API 2.2 for OData package as shown in the following image:
Step 3: In the project, in the Models folder, add a new class file of name ModelClasses.cs and add the following code in it:
using System.Collections.Generic;
using System.Linq;

namespace Raphael_Chart.Models
{
    //The CustomerOrders class for
    //reading the Total orders by Customers
    public class CustomerOrders
    {
        public string ContactName { get; set; }
        public int TotalOrders { get; set; }
    }

    //The DataAccess class for reading Orders by Customers
    public class DataAccess
    {

        NorthwindEntities ctx;
        public DataAccess()
        {
            ctx = new NorthwindEntities();
        }

        //Function for Retrieving Customers and Orders
        public List<CustomerOrders> GetInformation()
        {

            List<CustomerOrders> custorders = new List<CustomerOrders>();
            custorders = (from c in ctx.Customers.ToList()
                       from o in ctx.Orders.ToList()
                       where c.CustomerID == o.CustomerID
                       group o by o.Customer.ContactName into grpContact
                       select new CustomerOrders()
                       {
                           ContactName = grpContact.Key,
                           TotalOrders = grpContact.Count(t => t.OrderID == t.OrderID)
                       }).ToList();


            return custorders;
        }
    }
}
In the above code we have CustomerOrders class, this class contains properties for Customer ContactName and TotalOrders by customer. The GetInformation() method of the DataAccess class queries Customers and Orders Entity Classes and reads total orders group by ContactName.
Step 4: In the Controllers folder, add a new Empty WEB API Controller class of name ChartAPIController. In the class, add the following code:
using System.Collections.Generic;
using System.Linq;
using System.Web.Http;
using Rephael_Chart.Models;

namespace Raphael_Chart.Controllers
{
    public class ChartAPIController : ApiController
    {
        DataAccess ds;
        public ChartAPIController()
        {
            ds = new DataAccess();
        }

         [Queryable]
        public List<CustomerOrders> Get()
        {
            return ds.GetInformation();
        }
    }
}
Step 5: In the Controllers folder, add a new Empty MVC Controller of the name ‘ChartDataController’. In this controller, we have the Index action method. We need to generate the Index View from this action method.
Step 6: Since we need to use the Raphael library for creating charts, we need to add a reference to this library in the project using NuGet Package Manager as shown in the following image:
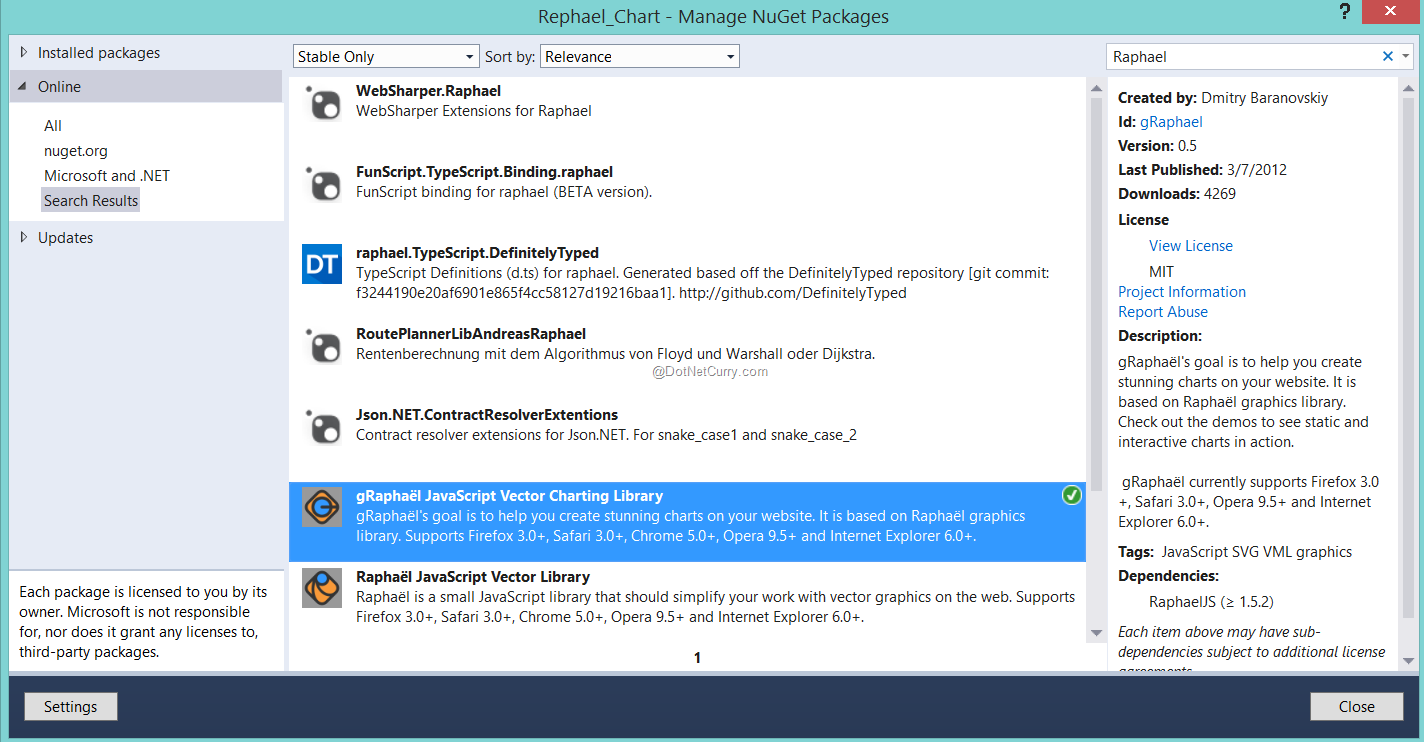
The gRaphael JavaScript Vector Charting Library
Step 7: Add the following script code in the Index.cshtml page along with the the HTML markup:
@{
    ViewBag.Title = "Index";
}

<style type="text/css">
    table {
      width:100%;
    }
    #dvLeft {
       height:400px;
    }
    #dvChart {
      height:800px;
      width:800px;
      background-color:azure;
    }
    select {
      width:140px;
    }
    #tblvalues,td {
       border:double;
    }
    thead {
      background-color:azure;
    }
</style>


<script src="~/Scripts/jquery-2.1.4.min.js"></script>
<script src="~/Scripts/raphael-min.js"></script>
<script src="~/Scripts/g.raphael-min.js"></script>
<script src="~/Scripts/g.raphael.js"></script>
<script src="~/Scripts/g.pie-min.js"></script>
<script src="~/Scripts/g.bar-min.js"></script>

<h1>Customerwise Orders</h1>
<hr />

<table>
    <tr>
        <td>
           <div id="dvLeft">
               <h3>Fetch Record Page Index (Each Page will get 10 Records)</h3>
               <select id="lstRecPages"></select>
               <hr />
               <h3>Select the chart Type:</h3>
               <select id="lstCharttype">
                   <option value="0">Select Chart</option>
                   <option value="1">Pie Chart</option>
                   <option value="2">Bar Chart</option>
               </select>
           </div>


        </td>
        <td>
            <div id="dvChart"></div>
        </td>
        <td>
            <div id="dvData">

            </div>
        </td>
    </tr>
</table>

<div id="dvMsg"></div>

<script type="text/javascript">
    $(document).ready(function () {

        loadPages();

        //The Function to load No. of Pages for the data received from the server.
        //Each Page has the default size of 10 records

        function loadPages() {
            var url = "/api/ChartAPI";
            $.ajax({
                url: url,
                type: "GET"
            }).done(function (resp) {

                //Get the number of pages.
                //Consider here the page size as 10

                var pgSize = resp.length / 10;

                //If the Result is float, then Round it to 1
                if (isPgSizeFloat(pgSize)) {
                    pgSize = Math.round(pgSize);
                }

                //Add Pages in the DropDown for record Pages
                var pgHtml = "";

                for (var i = 1; i <= pgSize; i++) {
                    pgHtml += "<option value=" + i + ">" + i + "</option>";
                }
                //Add Page Numbers
                $("#lstRecPages").append(pgHtml);
            }).error(function () {
                $("#dvMsg").html("Error " + err.status);
            });
        };

        //function to check for float
        function isPgSizeFloat(pg) {
            return pg === Number(pg) && pg % 1 !== 0;
        };

        //Function to Draw the Charts
        function drawChart(chartindex, pageindex) {
            var recordperpage = 10;
            //The Pagination for fetching data
            var url = "/api/ChartAPI?$top=" + recordperpage + "&&$skip=" + (recordperpage * pageindex);
            $.ajax({
                url: url,
                type: "GET"
            }).done(function (resp) {
                //The Array of Legends for the Chart
                var legends = [];
                //The Array of Values for the Chart
                var values = [];
                $.each(resp, function (idx, item) {
                    legends.push(item.ContactName);
                    values.push(item.TotalOrders);
                });

                loadDataInTable(resp);

                if (chartindex == 1) {
                    drawPieChart(legends, values);
                } else {
                    drawBarchart(legends, values);
                }
            }).error(function (err) {
                $("#dvMsg").html("Error " + err.status);
            });
        };

        //Function for loading values
        //In Values
        function loadDataInTable(data) {
            $("#dvData").html("");

            var trs = "<table><thead><tr><td>Name</td><td>TotalOrders</td></tr></thead>";
            $.each(data, function (idx, d) {
                trs += "<tr><td>" + d.ContactName + "</td><td>" + d.TotalOrders + "</td></tr>";
            });
            trs += "</table>";

            $("#dvData").append(trs);
        };

        //The following function is used to draw chart based on chart type
        $("#lstCharttype").on('keyup change', function () {
            var val = $(this).find(":selected").val();
            //The Page Index
            var pgIndex = $("#lstRecPages option:selected").val();

            $("#dvChart").html("");
            if (val !== 0) {
                drawChart(val, pgIndex);
            }
        });

        //The following function can also be used to draw chart for selected page index
        $("#lstRecPages").on('keyup change',function(){
            var val = $("#lstCharttype option:selected").val();
            var pgIndex = $(this).find(":selected").val();
            $("#dvChart").html("");
            if (val > 0) {
                drawChart(val, pgIndex);
            }
        });

            //Function to Draw PIE chart
            //With center as 400,400 and redius as 200
            function drawPieChart(legends, values) {
                var r = Raphael("dvChart");
                r.piechart(400, 400, 200, values, { legend: legends, legendpos: 'east'});
            };

        //Function to Draw BAR chart
        //With x and y as 10,10
            function drawBarchart(legends, values) {
               var r = Raphael("dvChart");

               var b = r.barchart(30, 20, 400, 560, values, { stacked: true, type: "round",gutter:"20%" });//.label([['V1', 'V2']], false);

                //Creating the Custom Labels

               b.customXLabel = function (labels) {

                   this.labels = r.set();
                   for (var i = 0; i < this.bars.length; i++) {
                       str = labels[i].split(" ");
                       x = this.bars[i].x;
                       y = this.bars[i].y+ this.bars[i].h + 10;
                       r.text(x, y, str[0]).attr("font", "10px sans-serif");
                   }
                   return this;
               };
               b.customXLabel(legends);
            };
        });

</script>
Here’s a summary of what we are doing:
- loadPages()
- This function makes a call to the WEB API and retrieves the number of records from it. The importance of this function is to define the number of Pages in which the record count is divided. This is needed because the Raphael charts can show maximum 10 data points on a chart. If the number of data point is more than 10, the rest of the data is summarized into single data point. This method divides the response records count into a multiple of 10’s and the Page Indexes are dynamically added into the <select> using <option>.
- This function uses isPgSizeFloat() function to check if the result of divide by 10 to record count is a float. If the result is a float, then it is rounded to 1.
- This function is called in jQuery’s ready() function.
- drawPieChart() and drawBarChart() - These functions are used to draw PIE and BAR charts. These functions creates an object of Raphael by setting its container to dvchart <div> tag. These functions accept the legends and values parameter. These parameters represent charts legends and values data points respectively. The piechart() and barchart() functions are used to draw charts.
- drawChart() - This function is used to fetch records by making an Ajax call using JSON query operators in the url. This function makes a call to drawPieChart() and drawBarChart() functions and is called on the change event of the <select> elements of name lstrecPages and lstcharttype.
- loadDataInTable () - This function dynamically adds table in the dvdata <div> tag and displays the retrieved data in it.
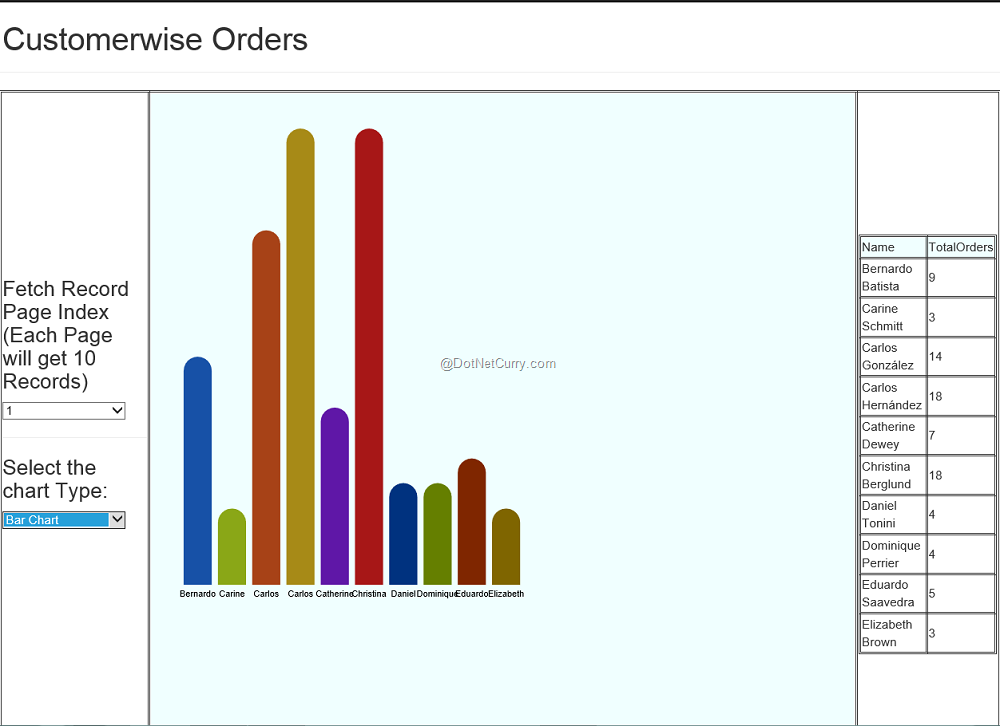
Step 8: Run the application. The following result will be displayed:
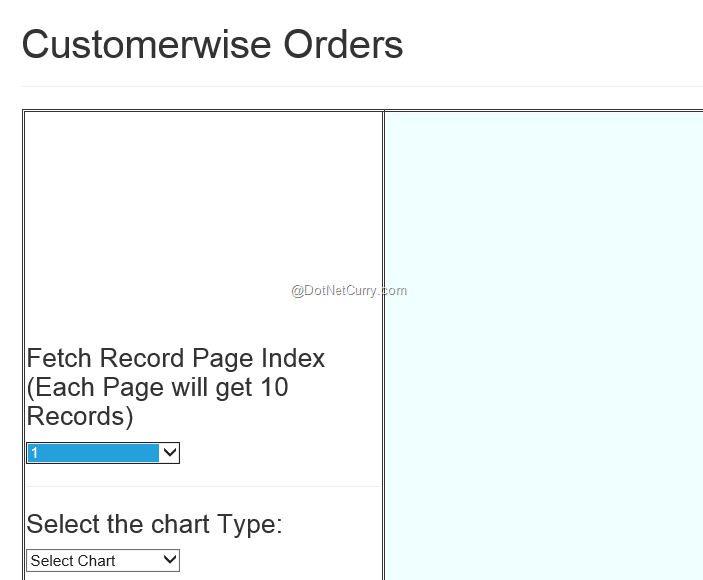
Select the Page Index from the first drop down and chart type from the second drop down. A Bar chart and Pie Chart will be displayed as shown here:
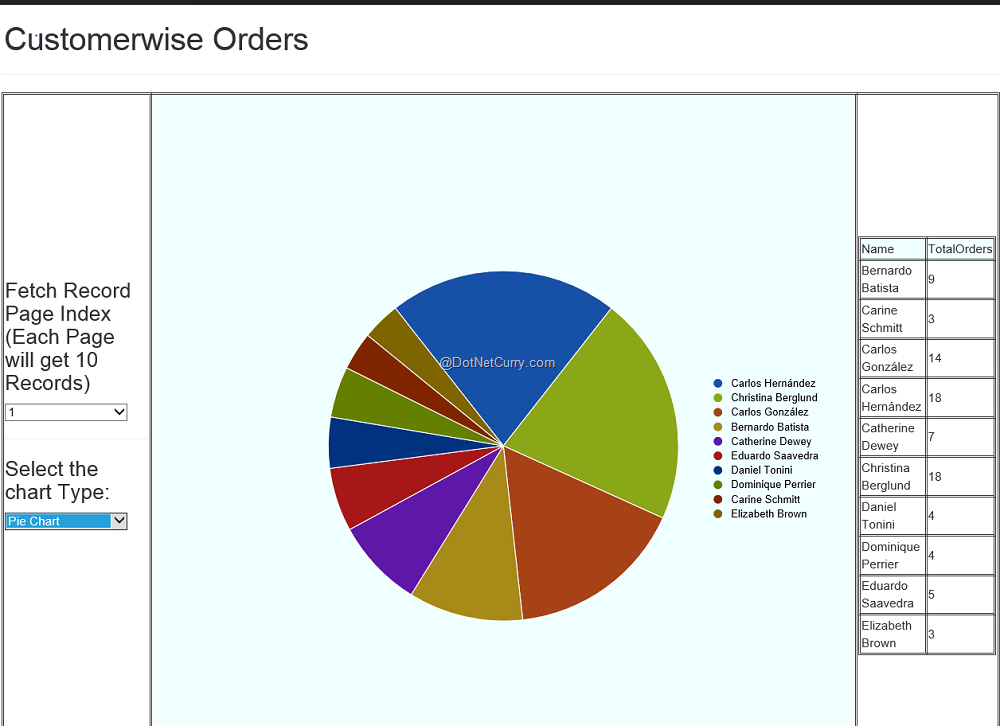
Conclusion: As you saw, we used the RaphaelJS library to draw some rich vector charts in our ASP.NET MVC application. Since these drawings are DOM objects, you can use JavaScript to dynamically access and manipulate them the way you want to. If you run your imagination wild, you will see that the capabilities of the RaphaelJS library are unlimited.
Download the entire source code of this article (Github)
This article has been editorially reviewed by Suprotim Agarwal.
C# and .NET have been around for a very long time, but their constant growth means there’s always more to learn.
We at DotNetCurry are very excited to announce The Absolutely Awesome Book on C# and .NET. This is a 500 pages concise technical eBook available in PDF, ePub (iPad), and Mobi (Kindle).
Organized around concepts, this Book aims to provide a concise, yet solid foundation in C# and .NET, covering C# 6.0, C# 7.0 and .NET Core, with chapters on the latest .NET Core 3.0, .NET Standard and C# 8.0 (final release) too. Use these concepts to deepen your existing knowledge of C# and .NET, to have a solid grasp of the latest in C# and .NET OR to crack your next .NET Interview.
Click here to Explore the Table of Contents or Download Sample Chapters!
Was this article worth reading? Share it with fellow developers too. Thanks!
Mahesh Sabnis is a DotNetCurry author and a Microsoft MVP having over two decades of experience in IT education and development. He is a Microsoft Certified Trainer (MCT) since 2005 and has conducted various Corporate Training programs for .NET Technologies (all versions), and Front-end technologies like Angular and React. Follow him on twitter @
maheshdotnet or connect with him on
LinkedIn