MiniProfiler is a profiling library that helps you monitor the performance of your ASP.NET application. It is performant enough to be used in production. Developed by some members of the StackExchange team, it is available as a Nuget Package and is easy to get started with. Today, we’ll see how we can use it to Profile an ASP.NET application using EF Code First as its Data Access layer.
The Sample Application
We will use an existing Sample from one of my older posts and add profiling to it. The DataList in ASP.NET MVC & KnockoutJS is an MVC Sample that uses AJAX to fetch/post data so we’ll be able to see both AJAX and Non-Ajax calls getting profiled.
You can either start off with an existing project that you may want to profile or download the sample and follow along.
Installing and Configuring MiniProfiler
Thanks to Nuget, installing MiniProfiler is easy
PM> Install-Package MiniProfiler
Adding the HtmlHelper
MiniProfiler adds a small div on the top left corner of your home page that you can use to pull down the profiling details. So the first step is to add an Html Helper provided my MiniProfiler to your _Layout page. Add a reference to the StackExchange.Profiling namespace and then at the bottom of the page, insert a call to render the Profiler.
@using StackExchange.Profiling;
<!DOCTYPE html>
<html lang="en">
<head>
…
</head>
<body>
…
@Scripts.Render("~/bundles/jquery")
@RenderSection("scripts", required: false)
@MiniProfiler.RenderIncludes()
</body>
</html>
Hooking the Profiler in
In the Global.asax, add the following event handlers to start and stop the Profiler. The Request.IsLocal guard clause makes sure the profiler is only working when you are accessing the application in development or on the deployed server.
protected void Application_BeginRequest()
{
if (Request.IsLocal)
{
MiniProfiler.Start();
}
}
protected void Application_EndRequest()
{
MiniProfiler.Stop();
}
That’s about it! Run the application now and you’ll see the profiler indicator come up.

Click on the [8.8 ms] label to see more

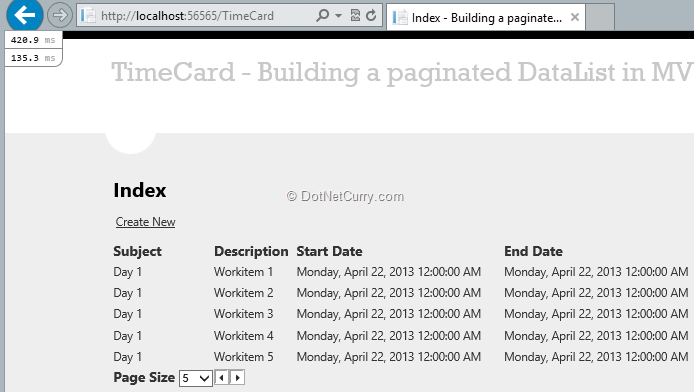
Now navigate to the TimeCard page

As you can see, there are two little divs on the top. Miniprofiler automatically detected the AJAX call and added separate profiling information for the AJAX call. Expanding it shows us the Ajax query and the time it took to do the query.

Now if you click on the ‘Next Page’ button to navigate to the next page, you will notice another little profile info button gets added with the new information.

Super cool! So far so good. We hardly interrupted our code using the profiler. From here on, there are two approaches to get more Profiling goodness:
1. Add inline code to add special profiling sections that emit information about how much time that section takes.
2. Use a global action filter to automatically profile each request
Fine Grained Control over Profiling
Before I even get started, some people might be put off by the fact that you have to write additional code for profiling. Well, I say it depends on how closely you want to monitor your system. It’s much like logging.
That aside, let’s see how we can narrow down the time taken by our AJAX call to fetch data from database. To do this, we update the Index action in the TimeCard controller as follows
[HttpPost]
public JsonResult Index(int pageNumber, int pageSize)
{
var profiler = MiniProfiler.Current;
List<TimeCard> cards = null;
using (profiler.Step("Data from Database"))
{
cards = db.TimeCards.OrderBy(o => o.Id).Skip<TimeCard>(pageSize * (pageNumber - 1))
.Take<TimeCard>(pageSize).ToList<TimeCard>();
}
return Json(new
{
PageNumber = pageNumber,
PageSize = pageSize,
Data = cards,
RecordCount = db.TimeCards.Count<TimeCard>()
});
}
Note the using(profiler…) section that now encapsulates the DB Call. The string passed to the profiler.Step(…) method is the Label that will be shown in the profiler.
Now run the Application and navigate to the TimeCard page. Expand the second profiler time. You see the Data from Database section that indicates how much time that section specifically took. Click on the show time with children to see when exactly the section started processing which gives us an idea of how much time was spent outside the section we marked.

As seen above
- The Ajax call itself took 282 ms including the child section.
- The database section took 102 ms itself and it started 166ms after the Request was received.
- Quickly calculating 282 – (166+102) = 14 ms were spent after the database call was executed.
This is a load of good information but what if I don’t want to sprinkle code with profiler.Step(…) statements? Well you will lose out on the Granularity simple. However you can get a little more generic information if you want using the MVC Action Filter.
Using the ProfilingActionFilter to profile ASP.NET MVC Controller
In the App_Start\FilterConfig.cs, register the ProfilingActionFilter that comes in with MiniProfiler.
public static void RegisterGlobalFilters(GlobalFilterCollection filters)
{
filters.Add(new HandleErrorAttribute());
filters.Add(new ProfilingActionFilter());
}
Now run the application and check the Profiler output. Click on the show trivial link to see all events profiled. You’ll see something like the following:

As you can see this, is a pretty detailed dump of path taken to execute the Index action. Of course if you want to profile this as well your custom steps, you are free to do so.
Profiling a MVC View
Profiling a View is a little more involved as it involves wrapping all your views with a Profiler view. However as with most things in MiniProfiler, it is not very invasive. In the Application Start event, add the following code
var copy = ViewEngines.Engines.ToList();
ViewEngines.Engines.Clear();
foreach (var item in copy)
{
ViewEngines.Engines.Add(new ProfilingViewEngine(item));
}
This picks up each view engine that is registered and wraps it in the ProfilingViewEngine wrapper. Internally the ProfilingViewEngine wrapper simply adds a call to the profiler.Step(…) and passes the call on to the base wrapper.
When we run the application with the ProfilingViewEngine enabled, the profile is enhanced further as follows

As you can see, it logs time required to Find and Render each view.
Profiling Entity Framework Database
The MiniProfiler has built in capabilities to profile your EF Database calls as well. In fact it can profile database calls using EF, Linq-to-Sql and Dapper. To profile EF, add the additional dependency of MiniProfiler.EF using Nuget
PM> install-package MiniProfiler.EF
Once installed add the initialization call in Application_Start() event and you are good.
MiniProfilerEF.Initialize();
Run the Application and Navigate to the TimeCard index page. Note the ‘2 sql’ link and the extra query time column.

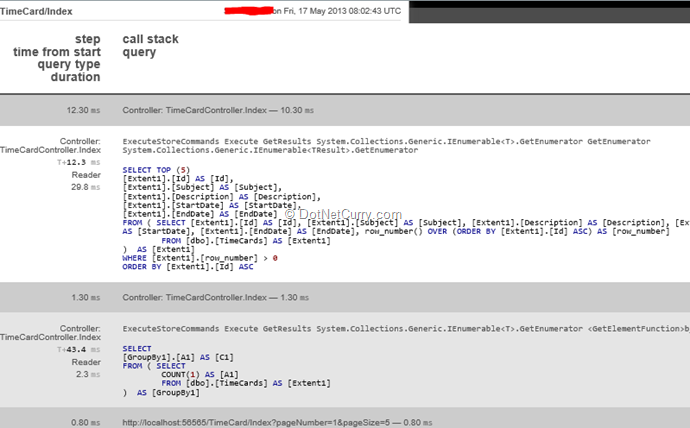
The 2 sql call indicates that MiniProfiler.EF detected two database calls. Click on the link so see details of the calls

WOW! That was truly a jaw-dropping moment for me! Our controller makes two calls to the database, one to fetch the data page of data and the other to get the count of rows. Both the queries that were executed are shown above and it includes time taken by each.
Other built in features of MiniProfiler.EF
The profiler can detect N+1 calls as well as duplicate queries (in the same context) allowing you to optimize and batch calls if possible. Way cool!
Conclusion
Profiling infrastructure is extremely important for understanding and fixing problems and bottlenecks at runtime. The MiniProfiler built by the StackExchange team has a lot of things going for it by being easy to setup, easy to enable and having results that are easy to interpret.
It is lightweight enough to be tried on production though your mileage may vary, so try it out on a staging system first.
Download the source code of this article (Github)
This article has been editorially reviewed by Suprotim Agarwal.
C# and .NET have been around for a very long time, but their constant growth means there’s always more to learn.
We at DotNetCurry are very excited to announce The Absolutely Awesome Book on C# and .NET. This is a 500 pages concise technical eBook available in PDF, ePub (iPad), and Mobi (Kindle).
Organized around concepts, this Book aims to provide a concise, yet solid foundation in C# and .NET, covering C# 6.0, C# 7.0 and .NET Core, with chapters on the latest .NET Core 3.0, .NET Standard and C# 8.0 (final release) too. Use these concepts to deepen your existing knowledge of C# and .NET, to have a solid grasp of the latest in C# and .NET OR to crack your next .NET Interview.
Click here to Explore the Table of Contents or Download Sample Chapters!
Was this article worth reading? Share it with fellow developers too. Thanks!
Suprotim Agarwal, MCSD, MCAD, MCDBA, MCSE, is the founder of
DotNetCurry,
DNC Magazine for Developers,
SQLServerCurry and
DevCurry. He has also authored a couple of books
51 Recipes using jQuery with ASP.NET Controls and
The Absolutely Awesome jQuery CookBook.
Suprotim has received the prestigious Microsoft MVP award for Sixteen consecutive years. In a professional capacity, he is the CEO of A2Z Knowledge Visuals Pvt Ltd, a digital group that offers Digital Marketing and Branding services to businesses, both in a start-up and enterprise environment.
Get in touch with him on Twitter @suprotimagarwal or at LinkedIn