Microsoft Visual Studio 2015 Preview was recently released along with .NET 4.6 and contains many new and exciting features like support for cross platform development in C++, an open-source .NET compiler platform, Cordova Tooling, ASP.NET 5, IDE enhancements for Web development and much more. You can download Visual Studio 2015 Preview from the following link - http://www.visualstudio.com/en-us/downloads/visual-studio-2015-downloads-vs.aspx
In this article, we will be looking at some Debugging enhancements done in Visual Studio 2015, while comparing the same with Visual Studio 2013. We will also look at few new introductions in debugging the C# and VB.NET languages as well.
Let’s get started by creating a blank solution in Visual Studio 2013 as well as Visual Studio 2015, and then do the comparison between these two by writing a couple of programs.
Step 1: Create a blank solution with the name VisualStudio2013DebugDemo and VisualStudio2015DebugDemo under Visual Studio 2013 and Visual Studio 2015 respectively.
Step 2: Add a class library with the name SalesLibrary in both the Visual Studio solutions and rename the class name as SalesCalculation.
Step 3: Add a SalesNetProfit function under both the Class Libraries available in VS 2013 and VS 2015. Write the following code in SalesNetProfile:
public class SalesCalculation
{
    public double SalesNetProfit(double COGS, double Expenses, double ActualSales)
    {
            return ActualSales - (COGS + Expenses);
    }
}
Step 4: Now use this SalesLibrary into a Console Application. Add a Console application under both Visual Studio with the name “SalesCalculatorUI” and add a reference to the SalesLibrary in SalesCalculatorUI. Your solution should look like the following:

Step 5: Now consume this SalesLibrary and call a SalesNetProfit function in our console application. Repeat this code in both VS 2013 and 2015. The code is shown here:
static void Main(string[] args)
{
        SalesLibrary.SalesCalculation calci = new SalesLibrary.SalesCalculation();
        double netProfit = calci.SalesNetProfit(2000, 4000, 16000);
        Console.WriteLine("Sales Net Profit is - $ {0}", netProfit);
        Console.ReadKey();
}
Setting Additional Breakpoint Information
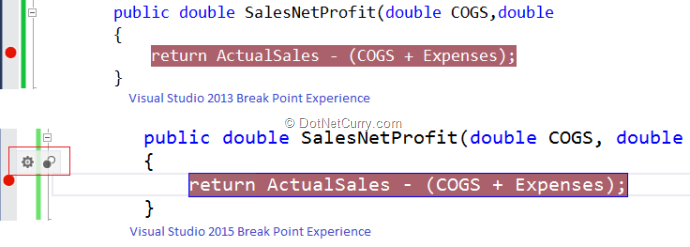
Step 6: Add a break point on the SalesNetProfit function in a class library under Visual Studio 2013 as well as Visual Studio 2015 and observe the break point:

In Visual Studio 2015, Microsoft has added a better experience for setting additional information about the break points with a short cut to Settings and Disable Breakpoint as shown above. If you want this functionality in Visual Studio 2013, you will have to right click and disable the breakpoint or go to settings using the Context menu. Let’s observe the Context menu for both VS 2013 and 2015. It is shown below:

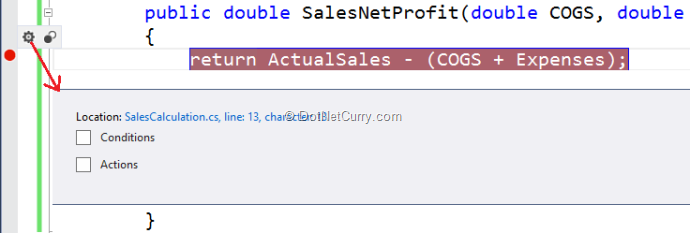
If you observe the context menu in both VS 2013 and VS 2015, you will find a clean and better experience with the latter as the Condition, Hit Count and other options are now moved to the Settings menu item in VS 2015. Let’s click on Settings in the VS 2015context menu . A separate window called Breakpoint Settings appears which allows you to set the Conditions and Actions as shown here:

Conditional Breakpoints
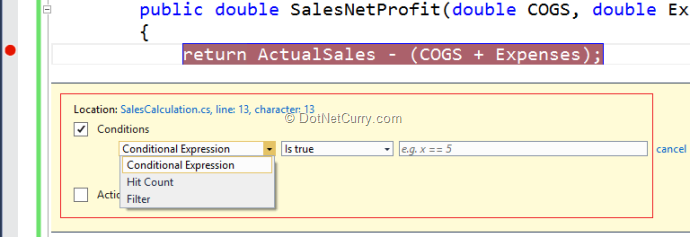
Check the Conditions check box which will allow you to set the conditions for your Breakpoint. For example, I want to hit the breakpoint if my actual sales is below $ 1000. Look at the Conditions options as shown here:

You can see that you can now set conditions for the breakpoint. You can set Hit Count to execute the breakpoint and you can apply the filters in a nice, easy-to-use interface.
In Conditions, you can set multiple conditions as per your requirements, with the option to edit the code by keeping the Breakpoint settings option on.
Intellisense in Expression Window
You will also find some useful intellisense in the expression window as shown here:

I have set a couple of conditions in my Conditions section which you can find by downloading the source code (look at the bottom of this article). Run the code and observe the breakpoints by changing the values we are passing to our function and making the sales net profit less than 1000.
Breakpoint Actions
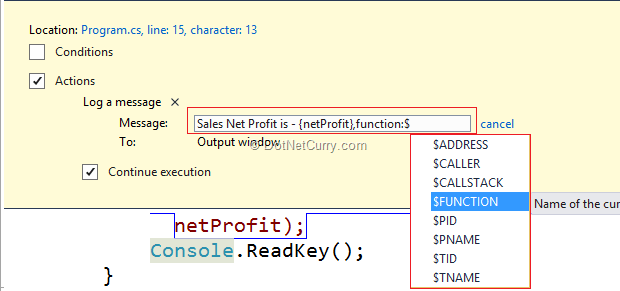
You can also add actions when the breakpoint is executed. For example, printing the values in the Output window could be the best way to watch values. The values which you want to print from the program must be enclosed in {} curly brackets. In our example, we have used {netProfit} as shown here:

The output of this action can be viewed in the Output Window:

Please note that these are not new options. These were there in the previous versions of Visual Studio. But with Visual Studio 2015, the accessibility of these features has become much simpler.
Writing Queries in the Immediate or Watch Window
Step 7: Now let’s add a LINQ-To-SQL class in Visual Studio 2015 in SalesLibrary and write a function that will return some data from the Northwind database. I already have SQL Server 2012 installed and Northwind database preconfigured on my machine. If you don’t have that setup, install it before moving ahead.

Now drag and drop a couple of tables from the Northwind database using Server Explorer.

Step 8: Let’s add a function which will fetch the customers and their orders in our SalesCalculation library. The code is as shown here:
NorthwindDataContext dataContext = new NorthwindDataContext();
public List<Customer> FetchCustomer()
{
    var customers = dataContext.Customers.ToList();
    return customers;
}
In the above code we are returning Customers from customers table of Northwind database. Now if you would like to debug this code and add some conditions or assumptions, you will have to first change the code and then run it to observe the changes.
In Visual Studio 2015, while debugging the code, we can now write queries [LINQ Query/Lambda Expression] targeting the data in the Immediate Window or Watch Window. Yes you can debug Lambda expressions too! Let’s try some of them.
Let’s add a breakpoint on the return statement and execute the code by calling the function in our main method of the console application. When the breakpoint is hit, open the Watch window if it’s not already opened and write the LINQ query to see the result. The output is as shown here:

Now if you perform the same operation in Visual Studio 2013, you will see the following output:

This is a cool new feature introduced for C# and VB.NET developers which allows us to now write queries and test the output or perform some assumptions during debugging of our programs.
Now let’s see the same query in the Immediate Window. Run the program and when the breakpoint is hit, open Immediate Window and write the following code and see the results:

So with these new enhanced debugging features introduced in Visual Studio 2015, the accessibility of the different options during debugging and querying the data is now possible; which was not so easily accesibly or possible in Visual Studio 2013. At the end, these new features makes a developer’s life much simpler.
We will explore some more features in our forthcoming articles. Stay tuned!
Download the entire source code of this article (Github)
This article has been editorially reviewed by Suprotim Agarwal.
C# and .NET have been around for a very long time, but their constant growth means there’s always more to learn.
We at DotNetCurry are very excited to announce The Absolutely Awesome Book on C# and .NET. This is a 500 pages concise technical eBook available in PDF, ePub (iPad), and Mobi (Kindle).
Organized around concepts, this Book aims to provide a concise, yet solid foundation in C# and .NET, covering C# 6.0, C# 7.0 and .NET Core, with chapters on the latest .NET Core 3.0, .NET Standard and C# 8.0 (final release) too. Use these concepts to deepen your existing knowledge of C# and .NET, to have a solid grasp of the latest in C# and .NET OR to crack your next .NET Interview.
Click here to Explore the Table of Contents or Download Sample Chapters!
Was this article worth reading? Share it with fellow developers too. Thanks!
Pravinkumar, works as a freelance trainer and consultant on Microsoft Technologies. He is having over 10 years of experience in IT and is also a Microsoft Certified Trainer(MCT). He has conducted various corporate trainings on all versions of .NET Technologies including .NET, SharePoint Server, Microsoft SQL Server, Silverlight, ASP.NET, Microsoft PerformancePoint Server 2007 (Monitoring). He is passionate about learning new technologies from Microsoft. You can contact Pravinkumar at dabade[dot]pravinkumar [attherate] gmail[dot]com