With an increase in XAML based apps for Windows Phone, Windows 8+ and Universal apps, developers have been demanding new features for XAML in the areas of memory and CPU profiling, UI debugging, seamless integration between Visual Studio and Blend. The latest release of VS 2015 provides some new XAML development features for applications. In this article, we will take an overview of some of these new features.
Seamless Integration with Blend
Application development in XAML needs efforts from both UI Designer and Developer. In the development process, the UI Designer uses Blend to manage XAML design using design templates, styles, animations etc. Similarly the UI Developer uses Visual Studio to add functionality to the design. Many-a-times it is possible that the UI Designer and Developer work on the same XAML file. In this case, the file updated by the designer or developer should be reloaded by the IDE (Blend and Visual Studio) each time. Visual Studio 2015 contains new settings that allows the integration of the two IDEs to be seamless. Let’s explore this setting.
This article is published from the DNC Magazine for .NET Developers and Architects. Download this magazine from here [Zip PDF] or Subscribe to this magazine for FREE and download all previous and current editions
Step 1: Open Visual Studio 2015 and create a new WPF Application. In this project, open MainWindow.xaml and add a button to it. Here’s the XAML code:
<Button Name="btn" Content="Click" Height="50"
Width="230" Click="btn_Click" Background="Brown"></Button>
To update the XAML in Blend, right-click on the MainWindow.xaml and select Design in Blend option as shown in the following image:
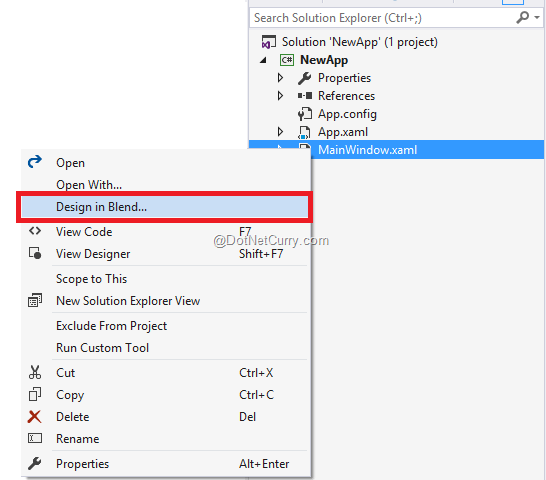
This will open the file in Blend. This blend version is more similar to the Solution Explorer window in Visual Studio.
Step 2: In Blend, change the Background property of the button to Red as shown here. (Observe the intellisense).
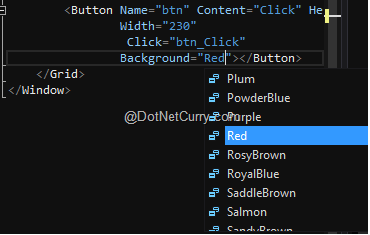
Save the file.
Step 3: Visit the project again in Visual Studio, and the following window will be displayed:
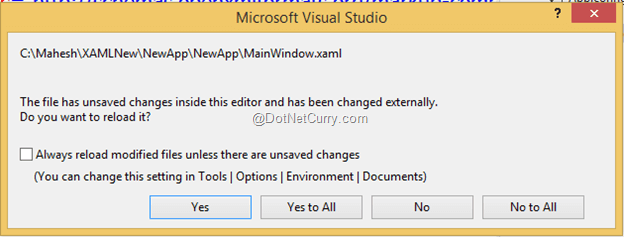
The above window notifies that the file is updated externally. To reload the file with the external changes, we need to click on Yes or on the Yes to All button. Once clicked, you will observe that the updates made in Blend will be reflected in Visual Studio. In Visual Studio the Background property will be updated from Brown to Red. We can manage this reload with seamless integration with the following settings.
In Visual Studio 2015, from Tools |Options |Environment |Documents select the checkbox as shown in the following image:
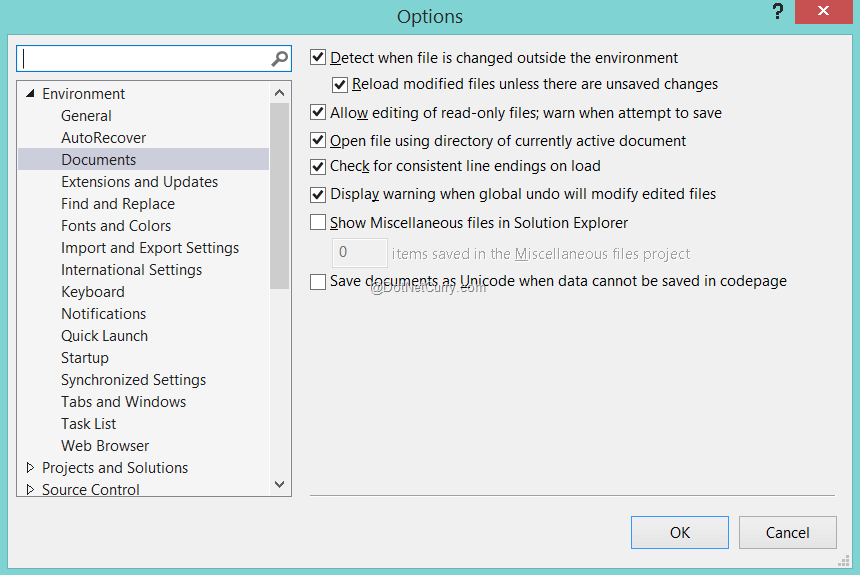
The CheckBox Reload modified files unless there are unsaved changes configuration will load changes made in the XAML file outside Visual Studio editor. Similar changes can be configured in Blend using Tools |Options |Environment |Documents. With this new feature, we can implement seamless integration between Visual Studio and Blend for efficiently managing XAML updates by the Designer and Developer.
Using Live Visual Tree for UI Debugging
In the process of DataBinding, new XAML elements may be added dynamically. To detect the UI elements added dynamically, we need a smart tool. In XAML based applications (e.g. WPF) the arrangement of XAML elements with its dependency properties is known as Visual Tree. In the VS 2015 release, a Live Visual Tree tool is provided. This tool helps to inspect the Visual Tree of the running WPF application and properties of element in the Visual Tree.
The Live Visual tree can be used for the following purposes:
- to see the visual tree with dynamically generated UI Elements based on the DataBinding, Styles, etc.
- to identify the critical sections of the generated Visual Tree which result in performance degradation.
Step 1: Open MainWindow.xaml and update the XAML as shown in the following code:
<Grid Height="346" Width="520">
    <Grid.RowDefinitions>
        <RowDefinition Height="300"></RowDefinition>
        <RowDefinition Height="40"></RowDefinition>
    </Grid.RowDefinitions>
    <DataGrid  Name="dgemp" AutoGenerateColumns="True" Grid.Row="0"/>
    <Button Name="btn" Content="Click" Height="30"
            Width="230"
             Click="btn_Click" Grid.Row="1"
            Background="Red"></Button>
</Grid>
Step 2: In the Code behind, add the following C# Code:
public partial class MainWindow : Window
{
    public MainWindow()
    {
        InitializeComponent();
    }

    private void btn_Click(object sender, RoutedEventArgs e)
    {
        //this.Background = new SolidColorBrush(Colors.RoyalBlue);
        dgemp.ItemsSource = new EmployeeList();
    }
}

public class Employee
{
    public int EmpNo { get; set; }
    public string EmpName { get; set; }
}

public class EmployeeList : List<Employee>
{
    public EmployeeList()
    {
        Add(new Employee() { EmpNo = 1, EmpName="A"});
        Add(new Employee() { EmpNo = 2, EmpName = "B" });
        Add(new Employee() { EmpNo = 3, EmpName = "C" });
        Add(new Employee() { EmpNo = 4, EmpName = "D" });
        Add(new Employee() { EmpNo = 5, EmpName = "E" });
    }
}
The above code defines the Employee class with Employee properties and EmployeeList class containing Employee Data. On the click event of the button, the EmployeeList is passed to ItemsSource property of the DataGrid.
Step 3: Run the Application. A WPF window will be displayed with Live Visual Tree panel as shown in the following diagram:
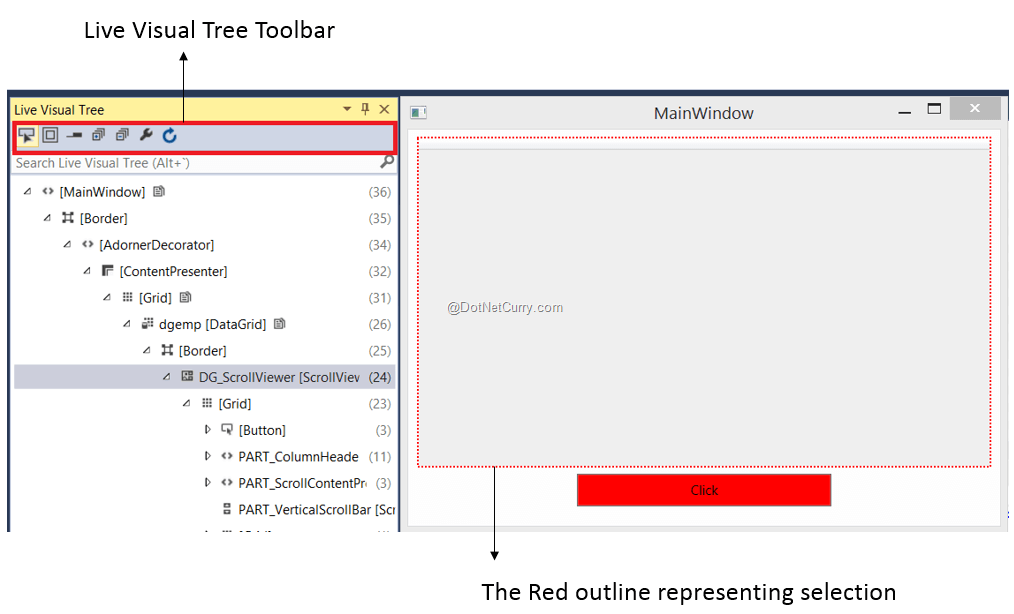
The Live Visual Tree has an Icon tool bar which provides options like Enable Selection in Running Application and Preview Selection. The above image shows the non-expanded Visual Tree. After expanding the Visual Tree, the panel gets displayed as shown in the following image:
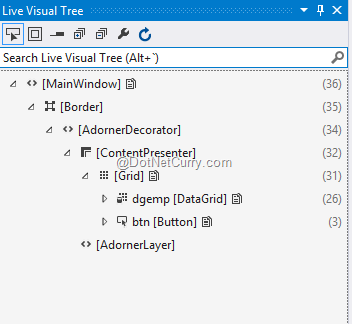
This shows DataGrid and a Button. Selecting the Button using the Mouse will select the Content property of the Button as shown in the following image:
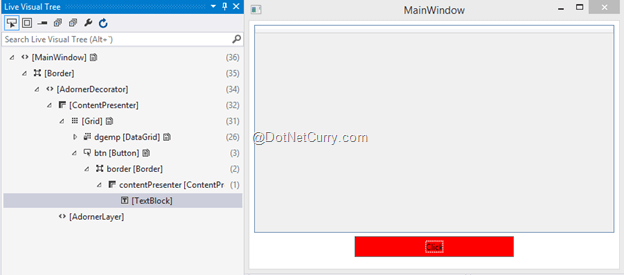
The ContentPresenter contains TextBlock containing Click text.
Step 4: Click on the Enable Selection in running application. This will clear the Button selection in the Live Visual Tree. Click on the button and the DataGrid will show Employee Data. Click in the Enable Selection in Running application and Preview Selection from the Live Visual Tree toolbar and select a row in the DataGrid. The Dynamically generated Visual Tree will be displayed as shown in the following Image
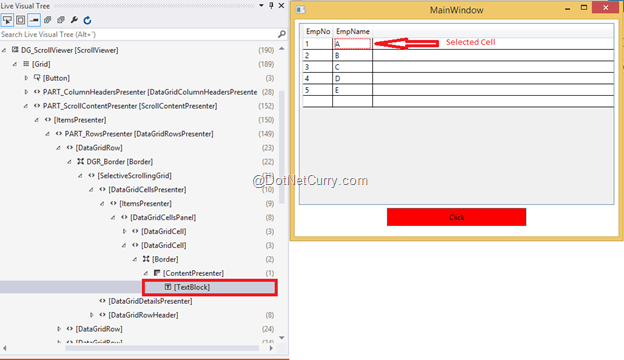
The above diagram shows the dynamically generated Visual Tree for the DataGrid. The ItsmsSource property of the DataGrid generates DataGridRow, which further contains DataGridCell, which in turn contains TextBlock. As we keep changing the selection in the DataGrid, the Live Visual Tree helps to debug the UI selection.
Hence this new tool helps developers to inspect the UI elements generated.
Live Property Explorer
Along with the Live Visual Tree, we have a Live Property Explorer tool as well. This tool shows the property set applied on the selected UI element. This also allows us to change some of the property values of selected element, at run time.
Select the button on the running application, the property explorer will be displayed as shown in the following image:
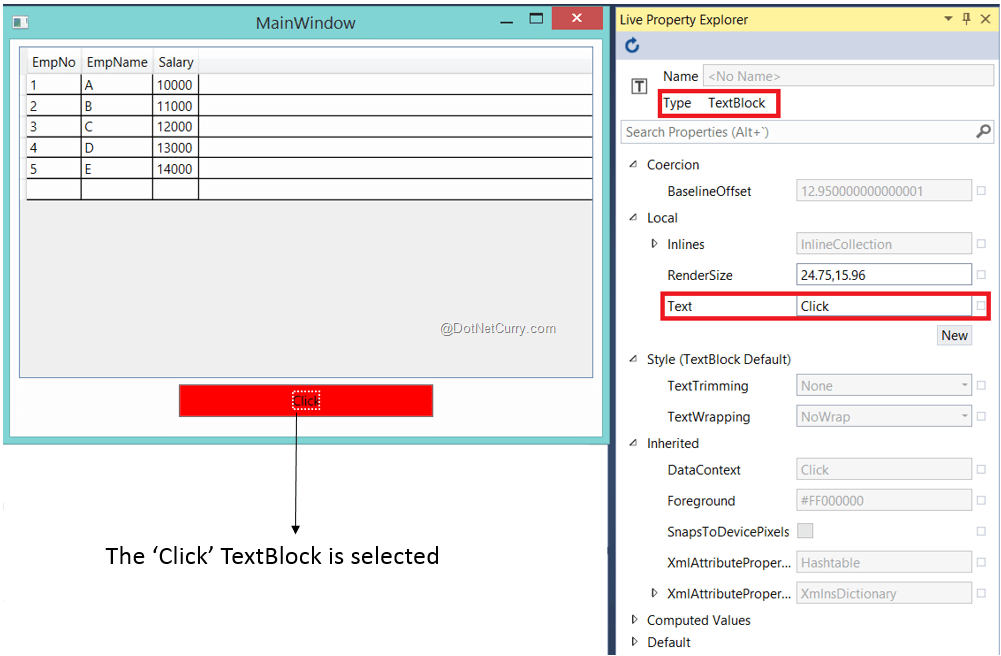
The Click Text is selected for the button, this shows the Live Property explorer for the TextBlock. Here we can change the Text property of the TextBlock while the application is running, as shown in the following image:
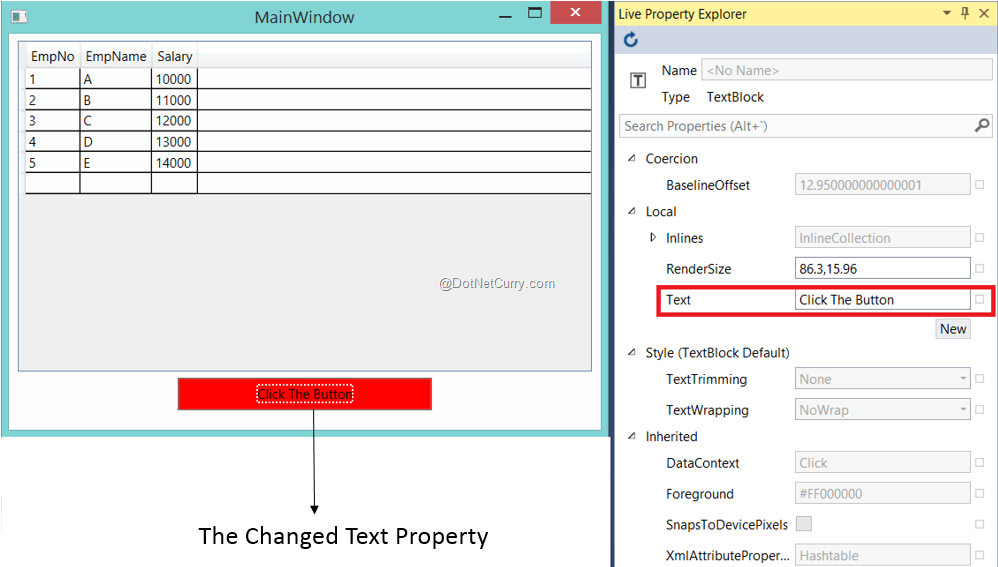
As you saw, the Live property explorer tool helps to update some properties while running the application. These changed properties can also be directly applied to the application.
Diagnostic Tool
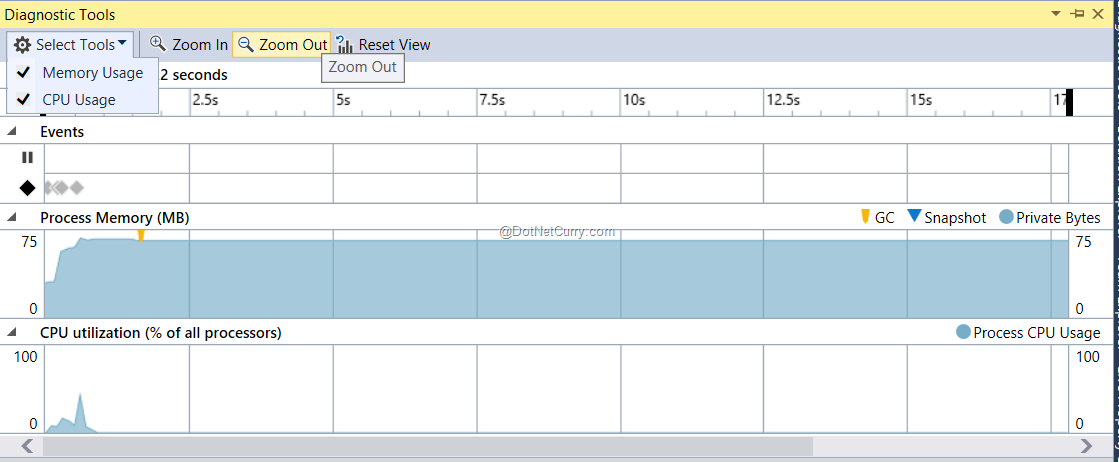
A new feature provided for XAML based application with this new release of Visual Studio 2015 is the Diagnostic Tools. This tool allows developers to check the Memory and CPU utilization for the XAML application. This tool can be enabled using Debug| Show Diagnostic Tool. Here we can select Memory Usage and CPU Usage. Run the application, and the CPU and Memory utilization can be seen as shown in the following diagram:
XAML Peak
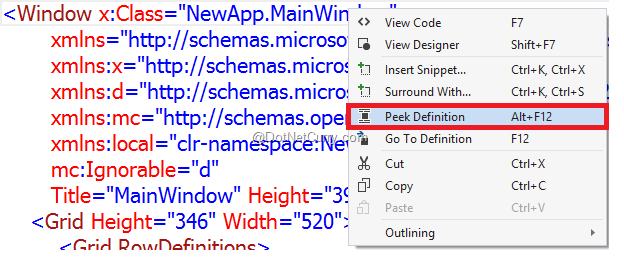
In Visual Studio 2015, a new feature for developers called the XAML Peek Definition has been introduced. In the earlier versions of Visual Studio, we could peek into definition for classes, functions, etc. in C# and VB.NET language. In Visual Studio 2015 we can use peek definitions for XAML elements as well. In the following diagram, we can see that when we right-click on the x:Class attribute value e.g. NewApp.MainWIndow and select the Peek Definition option from the context menu, we can see the class definition.
We can view the definition as shown in the following figure:

The advantages of this feature is that we can also use this to show styles/DataTemplate implementation for selected XAML elements as shown in the following diagram:
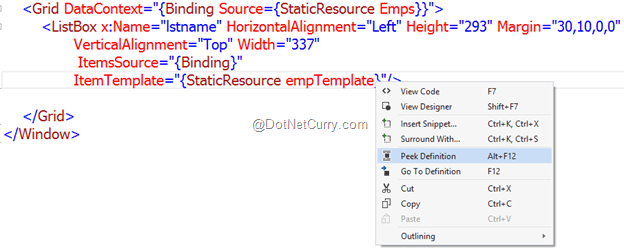
In the above diagram, the definition of the empTemplate can be shown:

Now we can edit one of the TextBlock e.g. Background property of the Salary TextBlock as follows:
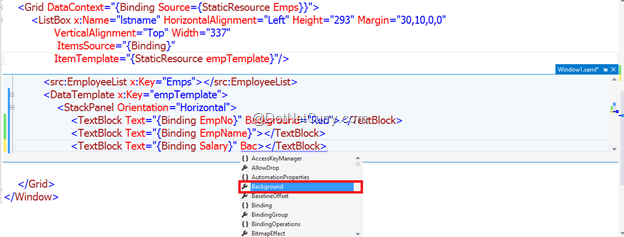
The changes made in the Peek Definition window can be seen in the actual DataTemplate definition. This is a very cool feature that excites the developer in me and hopefully yours too.
DataBinding Debugging
In Line-of-Business (LOB) application development in WPF, we implement databinding with XAML elements using the Binding class. We implement hierarchical DataBinding using DataContext property. In Visual Studio 2015 using the XAML extended feature, we can experience DataBinding debugging using Live Property Explorer.
Consider the following C# class:
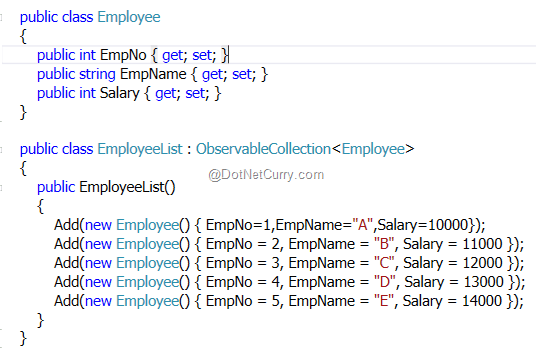
Consider the following XAML with Databinding:
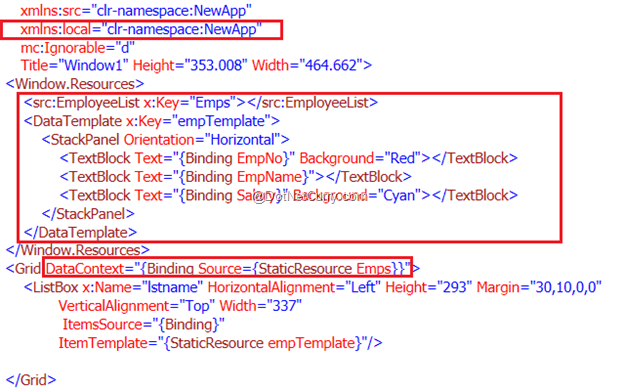
The above XAML applies to the EmployeeList instantiated with Emps.
Run the application and enable the Live Visual Tree and Live Property Explorer. We can see the DataContext property in the Live Property Window. We can now experience the DataContext values by selecting the Employee record from the ListBox as shown in the following figure:
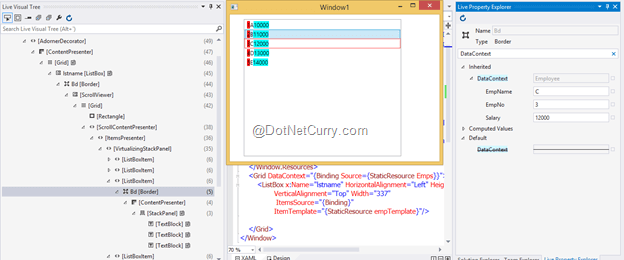
The above diagram shows the record selected from the ListBox (Red outline). On the right side of the diagram see the Live Property Explorer with the DataContext values. This is a cool feature for developers working on the LOB applications using XAML.
Defining Regions in XAML
While working with C# or VB.NET code in Visual Studio, we can make use of Region-EndRegion feature for defining groups of code for better manageability. In Visual Studio 2015, for long XAML markups, we can now define regions as shown in the following figure:


The Region after collapse will be displayed as shown in the following diagram:

Although this is a really simple feature, imagine the pain of the developer who works on long and complex XAML code for maintenance and could not group it until now.
Conclusion:
The new XAML tools provided in Visual Studio 2015 helps developers to effectively manage and work with XAML based applications for UI Debugging, Performance etc.
Download the entire source code from GitHub at bit.ly/dncm20-xamlnewtools
This article has been editorially reviewed by Suprotim Agarwal.
C# and .NET have been around for a very long time, but their constant growth means there’s always more to learn.
We at DotNetCurry are very excited to announce The Absolutely Awesome Book on C# and .NET. This is a 500 pages concise technical eBook available in PDF, ePub (iPad), and Mobi (Kindle).
Organized around concepts, this Book aims to provide a concise, yet solid foundation in C# and .NET, covering C# 6.0, C# 7.0 and .NET Core, with chapters on the latest .NET Core 3.0, .NET Standard and C# 8.0 (final release) too. Use these concepts to deepen your existing knowledge of C# and .NET, to have a solid grasp of the latest in C# and .NET OR to crack your next .NET Interview.
Click here to Explore the Table of Contents or Download Sample Chapters!
Was this article worth reading? Share it with fellow developers too. Thanks!
Mahesh Sabnis is a DotNetCurry author and a Microsoft MVP having over two decades of experience in IT education and development. He is a Microsoft Certified Trainer (MCT) since 2005 and has conducted various Corporate Training programs for .NET Technologies (all versions), and Front-end technologies like Angular and React. Follow him on twitter @
maheshdotnet or connect with him on
LinkedIn