The Magic of Visual Studio 2012 Page Inspector
Posted by: Sumit Maitra ,
on 5/28/2012,
in
Category Visual Studio
Abstract: We take a closer look at Visual Studio 2012 new Page Inspector functionality that helps developers debug their web UI from inside Visual Studio without having to ‘Alt-Tab’ between Browser and Visual Studio.
In our previous article Visual Studio 11 – Awesome New Features for Web Developers , while introducing new features of Visual Studio 2012 (aka VS 11) we had a brief look at a new functionality called Page Inspector. Today in this post, we are going to take a look at all the things that Page Inspector can do to speed up debug times for us.
What is the VS 2012 Page Inspector
For a lack of better term it’s a new ‘target browser’ for your Web Projects. VS 2012 lists all the browser on your system in the ‘Run’ tool button. So out of the box you will see IE and the Page Inspector.
The Page Inspector uses the IE browser engine and runs within Visual Studio with full browser functionality - as in JavaScript's, CSS are all applied as if it were a browser. You can select Page Inspector to be your default ‘browser’ of choice so that every time you hit F5, your application executes in it.

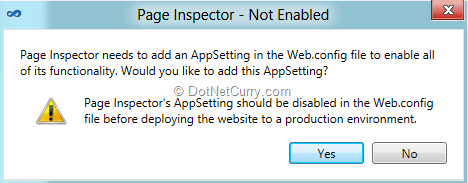
On first run, Page Inspector will ask you if it’s okay to add a new config entry. This is a one-time (per project) question.
Features of Page Inspector
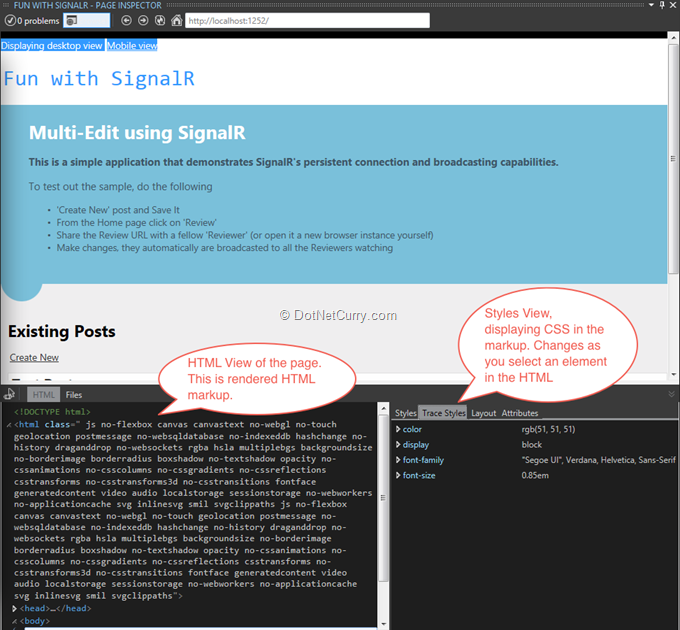
1. Developer Tools:
The default (Developer tools from IE) are baked in so CSS view, HTML view come by default for application being debugged INSIDE Visual Studio
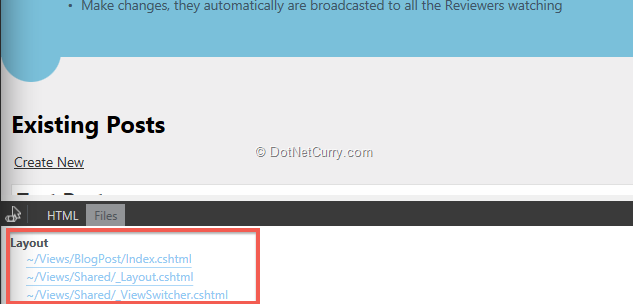
2. Files View:
A “Files” view indicating the SERVER SIDE files that are used for rendering the current page. E.g. in the image below, we see the current page has been rendered by the partial outputs from Index.cshtml, _Layout.cshtml and _ViewSwitcher.cshtml.
This feature is important for reviewing/debugging portal type applications that may have multiple partial views embedded.
3. The Inspection Mode
Inspection Mode in Page Inspector is a real time saver when debugging rendering and layout issues in applications with complicated page hierarchies. This is because in Introspection Mode, the Page Inspector starts tracking the mouse hover over each HTML element and then ties it back to the server side page that caused that bit of markup, and then opens the cshtml/vbhtml page and highlights the selection.

Above we see the ‘Toggle Inspection Mode’ button. It is off by default.
Using the Page Inspector to Debug Web Pages
Let’s walk through a simple scenario to see how we can use the Page Inspector.
Identifying Server-Side markup issues
We start our application and the home page looks as follows
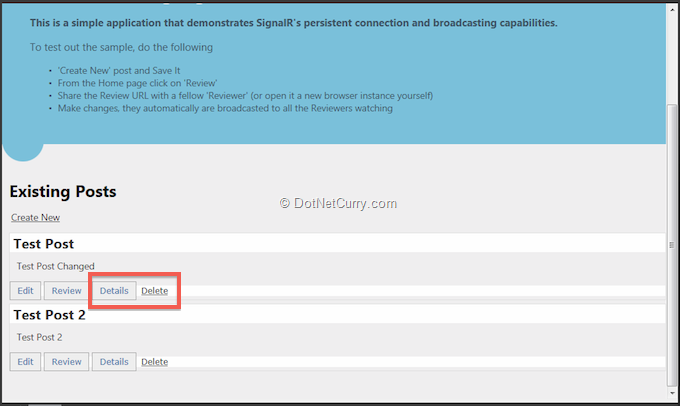
It seems the Delete button is rendered differently from the other ‘buttons’. So we initiate the introspection mode and hover over the Delete button
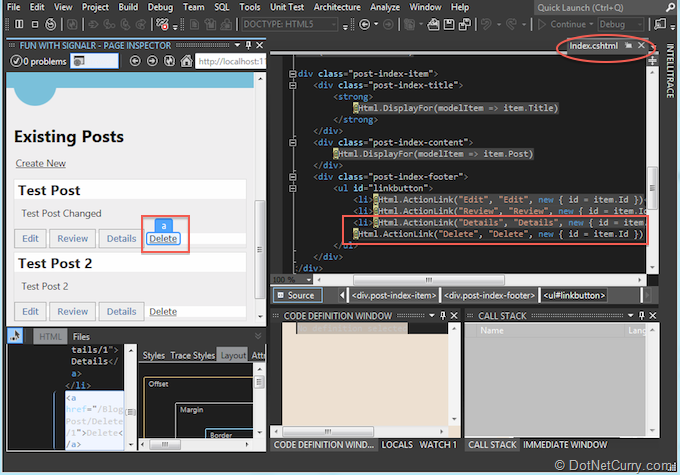
Immediately the page in which the markup for this button exists, is brought up and the selected button is highlighted.
Note: As a part of a new VS 11 feature being leveraged by Page Inspector here, the Index.cshtml tab is opened on the right hand side. Tabs that are transient like the current one or say when you hit F12 for ‘Go To Definition’ are now opened on the right hand side. This prevents opening up lots of tabs when you are simply browsing through code.
Coming back to our errant markup see that it is missing an <li> wrapper and hence is looking different.
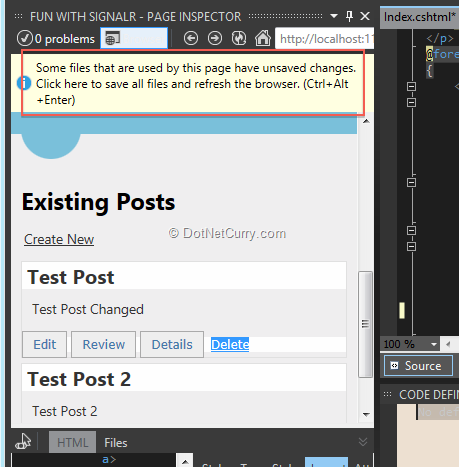
So we fix the markup.
Notice immediately Page Inspector detects the change and suggests you hit Ctrl+Alt+Enter to refresh with the latest changes
Once we refresh, as instructed our changes are visible immediately
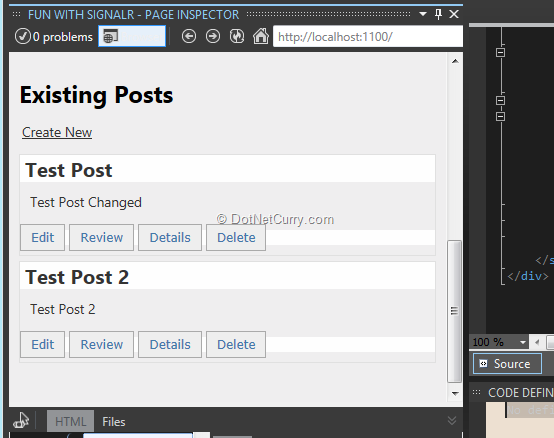
Done. The issue is fixed.
Without the Page Inspector our workflow for the above would probably be
- Jump back and forth between IE and Visual Studio after you see the error
- Make a guess that since it’s coming from the Home page it must be in the Home Folder under Views.
- But Home folder only has an Index_OLD.cshtml that probably means default route has been updated, so go to global.asax and figure out the default route.
- Navigate to Index.cshtml for the correct controller and then make the change.
- Save, jump back to browser and hit F5
As we can see, we saved ourselves a bunch of hassle using the Page Inspector. Yay!
Identifying and debugging CSS issues
In the above screenshot, we find that the Edit button is stuck to the left margin. We want to give it some whitespace there
- Again using Inspection Mode we track down the <li> which gets focus in the HTML View.
- Now we look at the Styles tab and click on the css class name post-index-footer. It immediately opens the CSS just like the cshtml earlier, with the correct css selected.
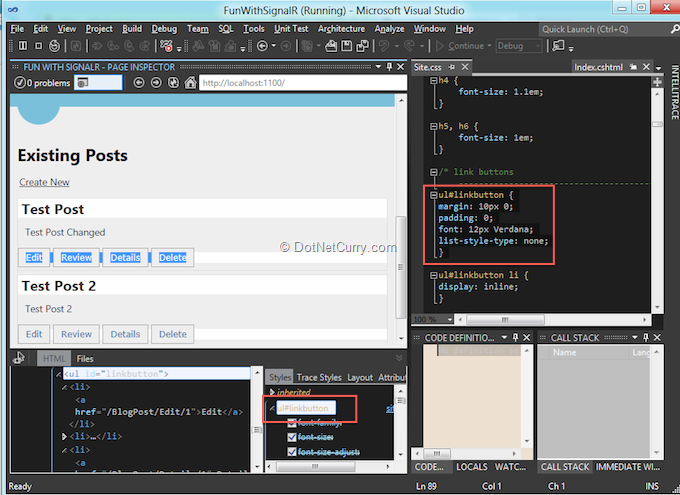
- Here we see the left and right margin is set to 0px.
- We update it to 10px and refresh the page
- Done, the CSS changes got applied.

Again without Page Inspector we would have to do the following using Visual Studio:
- Enable IE Dev tools
- Trace down the css class name.
- Come back to VS, open the correct CSS (which would be much more complex if you had more than one CSS files),
- Do a Ctrl+F to get to the class definition and update it.
- Then tab back to IE and hit refresh. Page Inspector gave us all this inside Visual Studio.
Page Inspector helped us in each of the above steps and did it all in Visual Studio.
Conclusion
The Visual Studio Page Inspector tool is an awesome productivity enhancement functionality for web developers. It brings the entire debug experience inside Visual Studio and it’s navigation capabilities help reduce searching and guess work.
Once VS 2012 is released, it will definitely help speed up Web Development and Maintenance tasks for web projects.
This article has been editorially reviewed by Suprotim Agarwal.
C# and .NET have been around for a very long time, but their constant growth means there’s always more to learn.
We at DotNetCurry are very excited to announce The Absolutely Awesome Book on C# and .NET. This is a 500 pages concise technical eBook available in PDF, ePub (iPad), and Mobi (Kindle).
Organized around concepts, this Book aims to provide a concise, yet solid foundation in C# and .NET, covering C# 6.0, C# 7.0 and .NET Core, with chapters on the latest .NET Core 3.0, .NET Standard and C# 8.0 (final release) too. Use these concepts to deepen your existing knowledge of C# and .NET, to have a solid grasp of the latest in C# and .NET OR to crack your next .NET Interview.
Click here to Explore the Table of Contents or Download Sample Chapters!
Was this article worth reading? Share it with fellow developers too. Thanks!
Sumit is a .NET consultant and has been working on Microsoft Technologies since his college days. He edits, he codes and he manages content when at work. C# is his first love, but he is often seen flirting with Java and Objective C. You can follow him on twitter at @
sumitkm or email him at sumitkm [at] gmail