Code Map and Debugger Integration in Visual Studio 2012 Ultimate
Posted by: Suprotim Agarwal ,
on 4/19/2013,
in
Category Visual Studio
Abstract: The Code Map and Debugger Integration in Visual Studio 2012 can add a lot of value in large sized projects with plenty of legacy code and sparse documentation. This article explore these new features.
Visual Studio is arguably one the most loved Integrated Development Environments specially when developing software on the Microsoft stack. Therefore it is no surprise that with every release, the Visual Studio Team introduces a new trick or feature that makes it even more endearing, easy to use and better for developer productivity.
In Visual Studio 2012 Ultimate edition for developers, there are a host of nifty features that help with debugging complex applications. I covered the parallel debugger recently. Today we will look at another debugging assistant, the ‘Code Map and Debugger Integration’.
The Code Map
Visual Studio 2012 Premium and Ultimate editions has had Code Maps since Update 1. It is a popular feature that enables creation of a Graph of code modules from existing Code. A Code Map creation can be initiated from any code module in the solution explorer.

The first invoke creates the internal graph generation. For example, when we invoked the CodeMap for Twittelytics.Domain dll, it generated only one Node. Similarly for Twittelytics.Data, we get one Node to start off with.

However we can start drilling down into it by expanding it to show smaller constituents of the projects till we reach the Interface/function level.

As we can see here, a Code Map helps visualize the code dependencies in our projects. Now imagine being able to step through the debugger and instead of having to peer into the stack trace, you are able to look at an object graph and it’s traversal as the code runs through it. That’s Code Map and Debugger Integration for you.
Code Map and Debugger Integration
With Visual Studio 2012 Update 2, Code Map was integrated with the debugger allowing developers to watch the program flow navigate through the code graph as they stepped through code. This is an amazingly useful feature and an invaluable tool when we are looking at poorly documented Legacy code. Suppose we are in a hurry to fix a bug buried deep in a layer and because of the depth, unable to trace back as to what else might be affected, the Code Map will give us the dependencies and the Debugger will help us determine the exact state of those dependencies. It does this by allowing to break at the point of change and look at the states of all the dependent entities.
Using the Code Map and Debugger Features
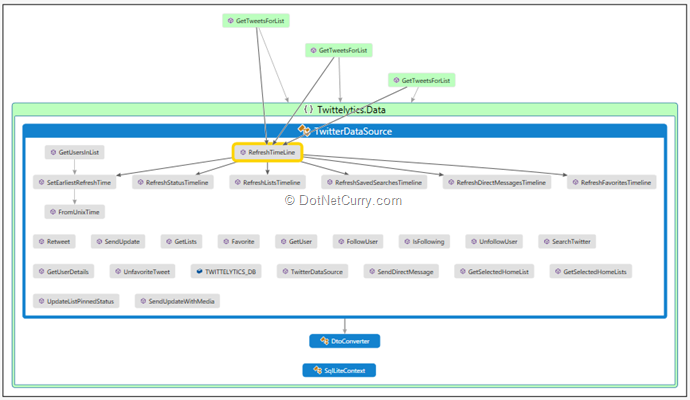
As we can see from the above code, we were able to narrow down to the RefreshTimeLine method that had multiple dependent methods as per the Code Map. Assuming we had a bug in the RefreshTimeLine method, we could easily right click on it and do the following
- Find all references: This would show us the methods calling into it.

- Go to Definition: Double clicking or doing a ‘Right-Click’ and ‘Go to Definition’ on the calling functions, would give us a side-by-side view of the code and the code map. As we can see here, we have navigated to the GetTweetsForList function.

- Similarly right clicking and selecting ‘Show Containing Types’ shows us the container classes. As we can see below, GetTweetsForList has two overloaded methods in TwitterDataService whereas SqliteDataServer has on function for GetTweetsForList.

Debugging with Code Map Open
So far we have seen the ‘Code Map’ part of the features. The real kicker is the Code Map traversal as we step through code. We were in the GetTweetsForList method. So let’s put a breakpoint here and run the application till we hit the breakpoint. As you can see, when Visual Studio hits the breakpoint, it shows the correct node in the Code Map highlighted.

Now if we Step into the code, we’ll see that the Code Map follows the code into TwitterDataSource

At this point, if we select the ‘Show Debug’ option on the Code Map, it shows us the complete path of execution

As we step further into the code, we can see the code map following along and getting deeper into the code stack.

Yet another option that gives us a clue on the future path is in the code map context menu called “Show Methods This Calls”. When invoked, it computes the possible paths ahead and shows the methods and their containers as we can see below

Flagging Modules and Adding Comments
Now that we have looked that all the navigation properties, there are some more utility functions that come with the Code Map + Debugger Integration.
1. First is the ability to flag a module and attach comments. If you see above, one of the function is flagged red and marked with a comment. These comments are separate from code but once a team member uses Code Map, they can see the comments and the flag. So if it’s their responsibility to fix it, then can update the flag and the comment.
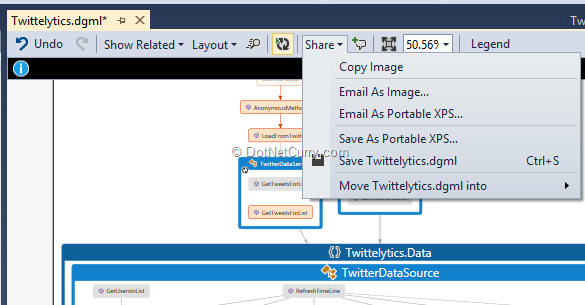
2. Sharing Options: Finally the Code Map can be shared in various formats as seen from this menu making it easy to use it for documentation, archival or simply brainstorming!

Conclusion
The Visual Studio Suite is a real value addition to any developer working on the Microsoft Stack. The Premium and Ultimate versions have a few differentiators and the Code Map + Debugger Integration is one such differentiator that can add a lot of value in large sized projects with plenty of legacy code and sparse documentation.
This article has been editorially reviewed by Suprotim Agarwal.
C# and .NET have been around for a very long time, but their constant growth means there’s always more to learn.
We at DotNetCurry are very excited to announce The Absolutely Awesome Book on C# and .NET. This is a 500 pages concise technical eBook available in PDF, ePub (iPad), and Mobi (Kindle).
Organized around concepts, this Book aims to provide a concise, yet solid foundation in C# and .NET, covering C# 6.0, C# 7.0 and .NET Core, with chapters on the latest .NET Core 3.0, .NET Standard and C# 8.0 (final release) too. Use these concepts to deepen your existing knowledge of C# and .NET, to have a solid grasp of the latest in C# and .NET OR to crack your next .NET Interview.
Click here to Explore the Table of Contents or Download Sample Chapters!
Was this article worth reading? Share it with fellow developers too. Thanks!
Suprotim Agarwal, MCSD, MCAD, MCDBA, MCSE, is the founder of
DotNetCurry,
DNC Magazine for Developers,
SQLServerCurry and
DevCurry. He has also authored a couple of books
51 Recipes using jQuery with ASP.NET Controls and
The Absolutely Awesome jQuery CookBook.
Suprotim has received the prestigious Microsoft MVP award for Sixteen consecutive years. In a professional capacity, he is the CEO of A2Z Knowledge Visuals Pvt Ltd, a digital group that offers Digital Marketing and Branding services to businesses, both in a start-up and enterprise environment.
Get in touch with him on Twitter @suprotimagarwal or at LinkedIn