IntelliTrace using Visual Studio 2013 Preview - Part 1
Posted by: Gouri Sohoni ,
on 9/19/2013,
in
Category Visual Studio
Abstract: IntelliTrace in Visual Studio can be effectively used to find the right information at the right time and maintain high quality code. In this article, we will walkthrough debugging an application using IntelliTrace
Every developer is interested in quick code and at the same time, does not want to compromise on the quality of code. Visual Studio provides some tools using which developers can achieve these goals. IntelliTrace is one such tool which can reduce the time taken for debugging an application.
Visual Studio 2010 provided this fabulous debugging tool with the Ultimate version. This tool collects data about an application while it is executing. The collected data can be stored with the help of an “.iTrace” file. This collected information can then be useful to the developer or her/his colleague for debugging. Many a times a bug that the developer receives, does not provide the steps to reproduce the problem encountered by the tester. With the help of Microsoft Test Manager (MTM), a bug work item can be created with IntelliTrace data which can be used by the developer to understand the exact problem. Visual Studio 2012 provided IntelliTrace in production environment so that without having any of the development tools installed on the server, it became possible to collect IntelliTrace data.
In this article, we will find out how IntelliTrace can be effectively used to find the right information at the right time, continue to debug the application and maintain high quality code. In the next article I will discuss how IntelliTrace can be enabled using Microsoft Test Manager and also how it can be applied in a production environment.
Debugging Application using IntelliTrace in Visual Studio
By default IntelliTrace is turned on and it automatically records certain events. You can find the default settings by using Tools – Options – IntelliTrace in Visual Studio

Observe there are 4 tabs for IntelliTrace namely General, Advanced, IntelliTrace Events and Modules.
Each of these tabs provides different functionality. Default behavior is to collect only IntelliTrace events information. If the calls and events information is captured, a lot of information will be gathered, but the application performance will also be hampered. With “Advanced” tab we can specify the location of “.iTrace” file and also adjust the size of it. The IntelliTrace file gets automatically deleted when the instance of Visual Studio is closed.
“IntelliTrace Events” tab provides the list of all events to collect data for. When we are debugging any Web Application ASP.NET, such related events can be useful.

Let us start with debugging a Windows Application. I have set the radio button to IntelliTrace events and calls information

If we set a breakpoint in the application while running, we can get calls as well as events information of the application we are executing. This will give us a complete history, as if we are debugging the application.
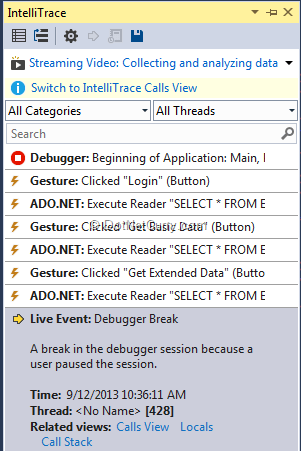
In a debugger break, we can view the IntelliTrace calls view as follows.

Observe we can also switch to Events View. All the events which we had configured will be captured. We can view Locals window as well as call stack.

Locals and call stack can be observed as follows


In Locals windows, we can observe the execute reader command as well as command text and connection string values. In call stack, we can observe the complete stack.
Clicking on an event will take you to the debugger session

It gives us all the functionality for debugging like step in, step out, go to previous call or next call as can be seen from the image (see yellow arrow to the left of above image).
While debugging, we can pin values of some variables and also provide comments if required


Comment box is shown for uname variable. IntelliTrace shows us values of basic variables, however complex variables values are not persisted.
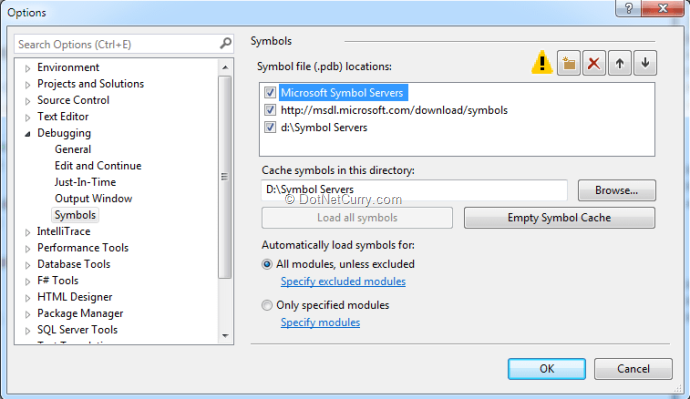
The debugging requires debug symbols which can be obtained from .pdb files. The location of these files can be set with the help of Tools – Options – Debugging – Symbols

So we just saw how IntelliTrace in Visual Studio 2013 helps in understanding the problem and also provides complete debugging information so that quality of the code can be maintained. In the next article, we will observe how IntelliTrace file can be collected using Microsoft Test Manager and also how IntelliTrace can be applied in a production environment.
This article has been editorially reviewed by Suprotim Agarwal.
C# and .NET have been around for a very long time, but their constant growth means there’s always more to learn.
We at DotNetCurry are very excited to announce The Absolutely Awesome Book on C# and .NET. This is a 500 pages concise technical eBook available in PDF, ePub (iPad), and Mobi (Kindle).
Organized around concepts, this Book aims to provide a concise, yet solid foundation in C# and .NET, covering C# 6.0, C# 7.0 and .NET Core, with chapters on the latest .NET Core 3.0, .NET Standard and C# 8.0 (final release) too. Use these concepts to deepen your existing knowledge of C# and .NET, to have a solid grasp of the latest in C# and .NET OR to crack your next .NET Interview.
Click here to Explore the Table of Contents or Download Sample Chapters!
Was this article worth reading? Share it with fellow developers too. Thanks!
Gouri is a Trainer and Consultant on Azure DevOps and Azure Development. She has an experience of three decades in software training and consulting. She is a graduate from Pune University and PGDCA from Pune University. Gouri is a Microsoft Most Valuable Professional (MVP) - Developer Technologies (Azure DevOps), Microsoft Certified Trainer (MCT) and a Microsoft Certified Azure DevOps Engineer Expert. She has conducted over 150 corporate trainings on various Microsoft technologies. She is a speaker with Pune User Group and has conducted sessions on Azure DevOps, SQL Server Business Intelligence and Mobile Application Development. Gouri has written more than 75 articles on Azure DevOps, TFS, SQL Server Business Intelligence and SQL Azure which are published on
www.sqlservercurry.com and
www.dotnetcurry.com. You can connect with her on
LinkedIn.