Deep Dive into IntelliTrace using Visual Studio 2013 for ASP.NET & other .NET Applications
Posted by: Gouri Sohoni ,
on 10/21/2013,
in
Category Visual Studio
Abstract: Using IntelliTrace in Visual Studio 2013 helps in understanding and pinpointing any problem encountered while executing any ASP.NET & other .NET applications
In our previous article IntelliTrace using Visual Studio 2013 Preview we discussed how IntelliTrace in Visual Studio 2013 helps in debugging. In this article, we will find out how “.iTrace” files can be created using Microsoft Test Manager and later debugged using Visual Studio. We will also find out the steps for debugging in production environment.
A tester tests the application and files a bug. The developer tries to find out how the bug popped up and here is a challenge, as at times it becomes difficult for a developer to completely understand the error encountered by the tester. In order to provide more information to the developer about the problem, Microsoft Test Manager supports various diagnostic data adapters. One of the adapters is to configure IntelliTrace events and calls information.
The test setting which captures IntelliTrace events is created and used by the tester while executing the test case.
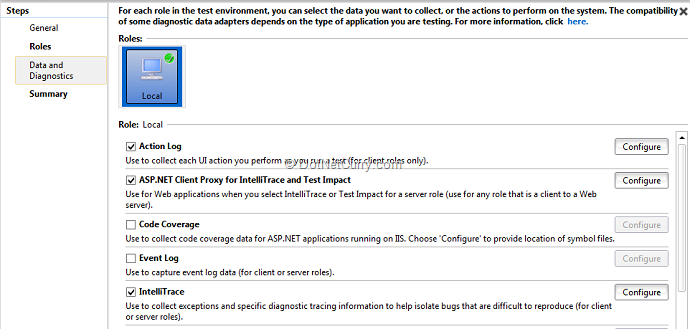
The above diagram shows the adapter for IntelliTrace. The different options are very similar as we have already seen in the previous article which is available with Visual Studio.
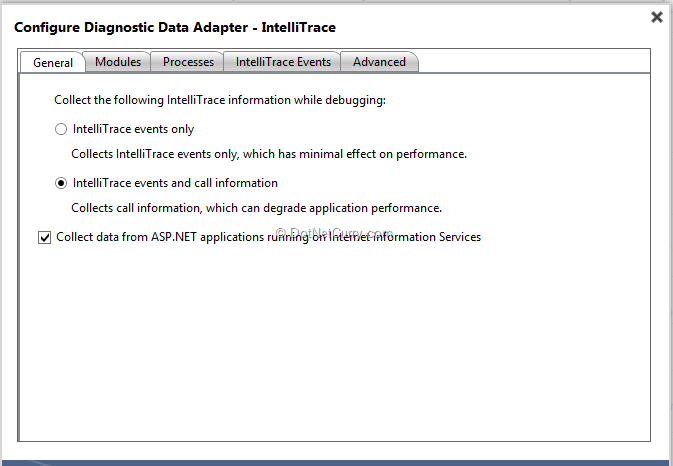
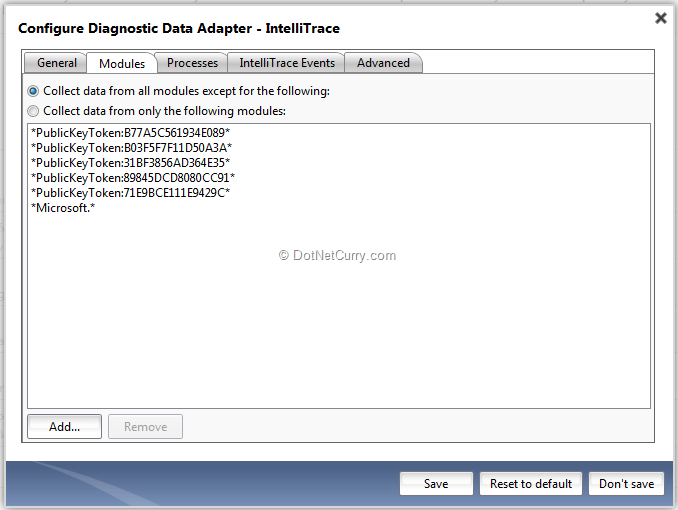
Observe the check box for collecting data from ASP.NET applications running IIS. If the application under test is a Web Application, this will be useful. With Modules tab, we can decide from which modules the information should be collected.
When a tester files a bug, the “.iTrace” file automatically gets associated with it. This file can be opened by the developer in a Visual Studio environment.
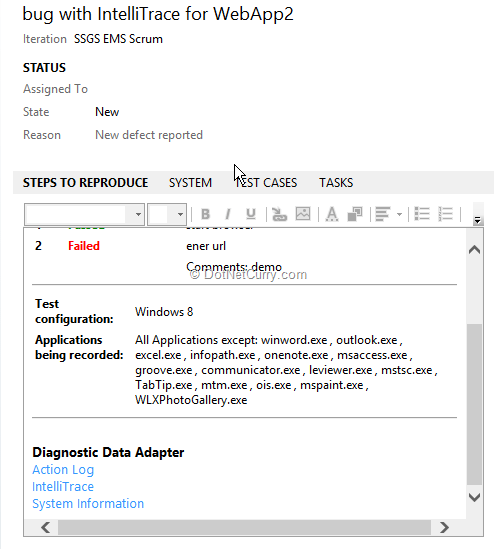
The file shows the following information in development IDE
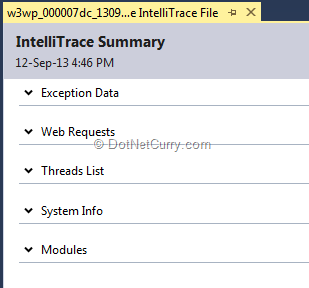
Exception Data: shows the recorded exceptions during execution. Each exception shows type, message.
Web Requests: provides all the web requests that were submitted to IIS pool. We can select one of the requests and click on the button for “Request Details” or double click the request. Request details provide request events and we can start debugging for a specific event. The required symbol will be loaded from the .pdb file and all the events information will be shown. We can now start debugging the application.
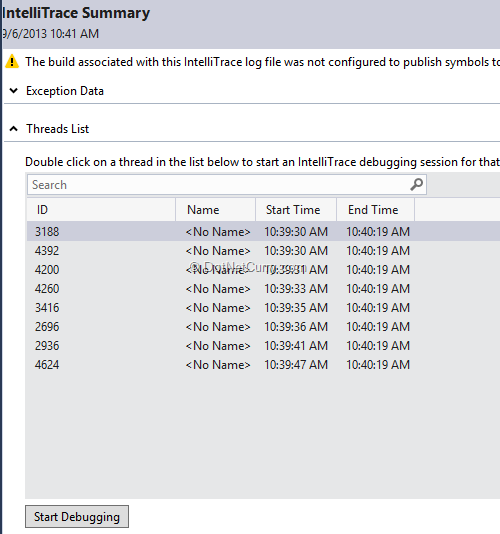
Threads List: lists the threads recorded while executing the application. We can start debugging the IntelliTrace event from a selected thread. Select a thread and click on Start Debugging.
Test Data: shows collected data by Microsoft Test Manager while executing the test case
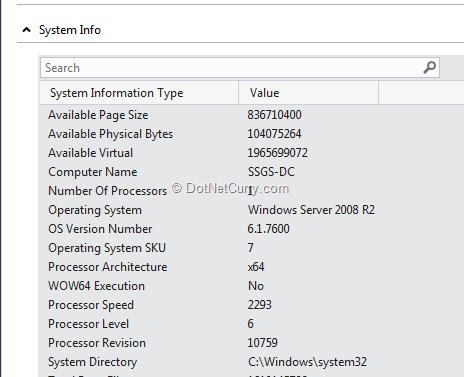
System Info: detailed information about the machine on which the application was hosted.
Modules: all the modules that were loaded in the sequence.
Now we can view all events and call information from development environment and start debugging the application. Locals, Call stack window will also provide us required information.
IntelliTrace in Production Environment
Let us find out how IntelliTrace data can be collected in a production environment.
In order to debug application in an environment outside Visual Studio, we have to follow certain steps. We can collect data from ASP.NET applications hosted on IIS 7.0, 7.5 and 8.0, SharePoint 2010 and 2013 and also desktop applications written in managed code.
Following are the steps to follow
1. Install IntelliTrace Collector.
Create a folder named IntelliTraceCollector on c drive. Go to IntelliTrace Collector and find IntelliTrace collector for Visual Studio. Download IntelliTraceCollector.exe in the newly created folder. Run the file which extracts .cab file.
2. Expand the .cab file by giving following command
expand /f:* IntelliTraceCollection.cab .
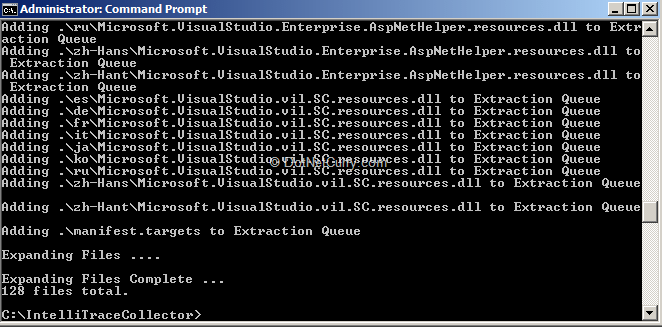
3. Do not miss the period (.) which is for preserving the sub-folders.
4. Grant permission for the IntellitraceCollector to the person who will execute PowerShell cmdlets. Install IntelliTrace PowerShell cmdlets to collect data for Web Apps.

5. Start – All Programs – Accessories – Windows PowerShell. Enter following command
Import-Module "C:\IntelliTraceCollector\Microsoft.VisualStudio.IntelliTrace.PowerShell.dll"
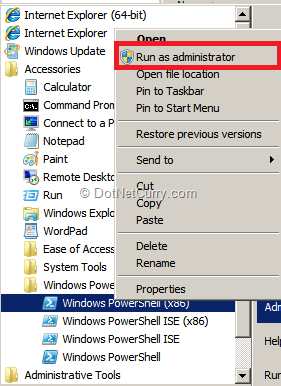
6. Create a folder for .iTrace file c:\IntelliTraceLogFiles which will collect the files.
7. To start collecting data, enter command
Start-IntelliTraceCollection “DefaultAppPool" "C:\IntelliTraceCollector\collection_plan.ASP.NET.default.xml" "C:\IntelliTraceLogFiles" IntelliTrace data collector.
If we want calls as well as events information the xml file is trace.xml. It can even be a custom file.
8. Execute the application. Stop-IntelliTraceCollection will stop the data collection.
9. Now we can open the “iTrace” file from Visual Studio environment.
10. We can create snapshot or “.iTrace” file using Checkpoint or check collection status using GET
In order to collect data in production environment without hampering the application performance you can follow these guidelines:
- Use the collector only when there is a problem
- When collecting for Web app, the collector records data for every app that shares the application pool. Host each application in a separate application pool
- Edit the data collection plan to disable events which are not required
- Include only modules in data plan which are relevant.
Using IntelliTrace helps in understanding and pinpointing any problem encountered while executing any application. The issues can then be removed and quality code can be obtained.
This article has been editorially reviewed by Suprotim Agarwal.
C# and .NET have been around for a very long time, but their constant growth means there’s always more to learn.
We at DotNetCurry are very excited to announce The Absolutely Awesome Book on C# and .NET. This is a 500 pages concise technical eBook available in PDF, ePub (iPad), and Mobi (Kindle).
Organized around concepts, this Book aims to provide a concise, yet solid foundation in C# and .NET, covering C# 6.0, C# 7.0 and .NET Core, with chapters on the latest .NET Core 3.0, .NET Standard and C# 8.0 (final release) too. Use these concepts to deepen your existing knowledge of C# and .NET, to have a solid grasp of the latest in C# and .NET OR to crack your next .NET Interview.
Click here to Explore the Table of Contents or Download Sample Chapters!
Was this article worth reading? Share it with fellow developers too. Thanks!
Gouri is a Trainer and Consultant on Azure DevOps and Azure Development. She has an experience of three decades in software training and consulting. She is a graduate from Pune University and PGDCA from Pune University. Gouri is a Microsoft Most Valuable Professional (MVP) - Developer Technologies (Azure DevOps), Microsoft Certified Trainer (MCT) and a Microsoft Certified Azure DevOps Engineer Expert. She has conducted over 150 corporate trainings on various Microsoft technologies. She is a speaker with Pune User Group and has conducted sessions on Azure DevOps, SQL Server Business Intelligence and Mobile Application Development. Gouri has written more than 75 articles on Azure DevOps, TFS, SQL Server Business Intelligence and SQL Azure which are published on
www.sqlservercurry.com and
www.dotnetcurry.com. You can connect with her on
LinkedIn.