A picture is worth a thousand words! When working with business applications, a major challenge is to present data in a graphical form that is not only accurate, but also easy to interpret. Charts are a popular medium of presenting data and results graphically and it becomes the responsibility of the team to make use of the most suitable technology and chart type, which can be data bound to a variety of data sources.
This article is published from the DotNetCurry .NET Magazine – A Free High Quality Digital Magazine for .NET professionals published once every two months. Subscribe to this eMagazine for Free and get access to hundreds of free tutorials from experts
Windows Presentation Foundation (WPF), is a widely used popular .NET technology which can be used to create Rich UX experiences for the end-user and provides a variety of graphical representations based on the WPF graphical capabilities. One of its useful graphical representation is the 2-D Shape API containing Line, Polyline, Rectangle, Ellipse etc., using which graphical charts can be created. However creating a feature rich graphical representation can be a very tedious task. Implementing different chart-types like the Pie, Bar, Column etc. can be very time consuming. It would help if a library exists that can be used to add simple graphs and charts in your application. What would be even nicer is if the same library can be used to create WPF as well as Windows Store apps.
The ModernUI Charts is one such free library created by Torsten Mandelkow which can be used in your WPF applications and also conceptually supports Windows Store Apps as well as Silverlight applications.
Disclaimer: The ModernUI Charts can be freely used in your application and are published under Microsoft Public License which grants you these rights. However these charts are in Beta and has not been updated since May 2013. So it is advisable that before using it any production ready application, make sure you have tested in thoroughly. Having said that, our purpose of showcasing this free library is to give you a head start if you are planning to build your own chart controls. You can even build on top of the ModernUI Chart library and create something that matches your business requirements. If you want a charting control that is high performing and production ready, try Lightning Chart from Arction.
The chart-types provided out-of-the-box in the ModernUI Charts library are as listed here:
- PieChart
- BarChart
- ClusteredBarChart
- StackedBarChart
- StackedBarChart100Percent
- ColumnChart
- ClusteredColumnChart
- StackedColumnChart
- StackedColumnChart100Percent
- Doughnut Chart
- Radial Gauge Chart
That is a quite a nice list for something that is available free of cost!
Creating an Application using the ModernUI Chart library
Installing the ModernUI Chart
Follow these simple steps to install the ModernUI chart library in your application
Step 1: Download the solution project for the Modern UI Chart from the following link http://modernuicharts.codeplex.com/
Step 2: Open the solution in Visual Studio 2012/2013 and build it. This should give you the ModernUI Chart libraries for WPF, Silverlight and Windows 8 Application development. For our demo, we will only be using the ModernUI Chart library for WPF and for that, we will be referencing it in a WPF 4.5 project which we will create shortly.
Note: The ModernUI Chart is still in its Beta, so for all custom requirements you need to extend the library on your own. The source code for it is available and for those who are really interested, that’s all that is needed to get started!
Obtaining a Data Source - AdventureWorks2012 Database
For our application, we will be using an Adventure Works database to give you a feel of a real application. The Database can be downloaded from the following link: http://msftdbprodsamples.codeplex.com/releases/view/55330
Once you have downloaded the AdventureWorks2012_Data.mdf file, integrate it with a SQL Server Instance on your server. We are using SQL Server 2012. We will be specifically using the SalesTerritory table from the database for displaying Sales data using ModernUI Charts.
Creating an Application Using WEB API and WPF
In our application, we will be using ASP.NET WEB API to fetch our sales data and make it available to the WPF Application for displaying charts. Follow these steps:
Step 1: Open Visual Studio 2013 and create a new blank solution, name it as ‘Modern_Charts_Service’. In this solution, add a new WEB API project. Call it as ‘WebApi_Service’.
Step 2: To this project, add a new ADO.NET Entity Data model and select AdventureWorks2012 database. From this database select the SalesTerritory table for mapping. After completing the wizard, the designer will look like the following
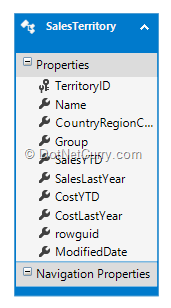
Figure 1: Sales Territory Table
In the application, we will using this table (as seen in Figure 1) to display chart by CountryRegionCode. For e.g. US, GB, etc.
Step 3: In the project, add a new WEB API controller project using Entity Framework:
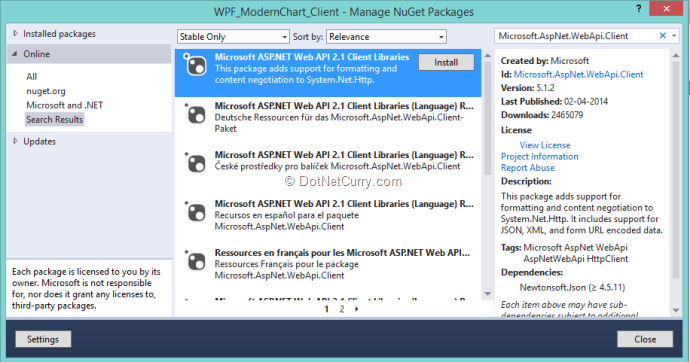
Figure 2: WebAPI 2 Controller project
Name the controller as ‘SalesTerritoriesController’. This step will generate the code for data access from the database, using Entity Framework.
Now build the project.
Step 4: To the solution created in the first 3 steps, add a new WPF 4.5 application and call it ‘WPF_ModernChart_Client’. In this project, add the assembly reference for the ModernUI Chart library for WPF. At the beginning of the article, we had discussed how to obtain this library. Once the library is added to your project, the project reference will look like the following in Solution Explorer:
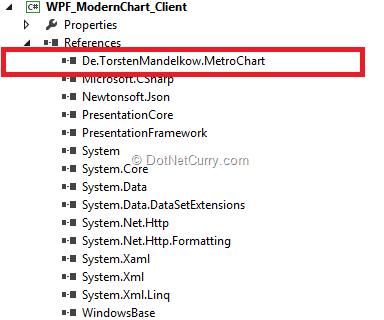
Figure 3: ModernUI Chart library
Step 5: In the project (bin\Debug folder) add an xml file with the name ‘ChartNames.xml’. This file will store the different chart names in it:
We will be using this file to read the available chart types and display them on UI. The respective chart will be automatically drawn based upon the selected chart type.
Step 6: Add a new folder with the name ‘HelperClasses’ to the project. In this folder, add a new class file and declare some classes in it.
using System;
using System.Collections.ObjectModel;
using System.Linq;
using System.Xml.Linq;

namespace WPF_ModernChart_Client.HelperClasses
{
    ///      /// The class used to store the Chart Name and its number     /// from the xml file.      ///
    public class ChartNameStore
    {
        public int Number { get; set; }
        public string Name { get; set; }
    }

    ///      /// The class used to load Chart types form the XML file.     ///
    public class ChartTypeHelper
    {
        ObservableCollection _ChartsNames;          ///          /// The Method Load the Xml file and return chart names.         ///          ///          public ObservableCollection GetChartNames()         {             _ChartsNames = new ObservableCollection();               XDocument xDoc = XDocument.Load("ChartNames.xml");              var Charts = from c in xDoc.Descendants("ChartTypes").Elements("Chart")                          select c;              foreach (var item in Charts)             {                 _ChartsNames.Add(new ChartNameStore()                 {                   Name =  item.Attribute("Name").Value,                  Number =Convert.ToInt32(item.Attribute("Number").Value)                 });             }              return _ChartsNames;          }     } }
The ChartNameStore class is used for representing the chart information and the ChartTypeHelper class contains the GetChartNames method which loads and reads the xml file created in the previous step and returns all the Chart names.
Step 7: Since we are using WEB API, we need to add the ASP.NET WEB API client libraries from NuGet, into our WPF project. This step will add all the necessary libraries to make a call to WEB API.
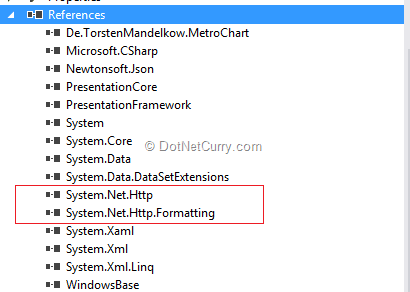
Figure 5: WPF Project references
Step 8: To the project, add a new folder with the name ‘ServiceAdapter’. In this folder add a new class file and write the following code:
using WPF_ModernChart_Client.ModelClasses;

namespace WPF_ModernChart_Client.ServiceAdapter
{
    ///      /// The class used to make call to WEB API and get the sales information     ///
    public class ProxyAdapter
    {
        ObservableCollection _SalesData;          public async Task
The above code makes use of the HttpClient class which helps to make an asynchronous call to WEB API. The BaseAddress property of the HttpClient class accepts the URI of the WEB API. The call is made over the uri and when completed, the data is read from it.
Step 9: To the project, add a new folder with the name ‘ModelClasses’ and add the following classes in it:
namespace WPF_ModernChart_Client.ModelClasses
{
    ///      /// The entity class for Sales information     ///
    public partial class SalesTerritory
    {
        public int TerritoryID { get; set; }
        public string Name { get; set; }
        public string CountryRegionCode { get; set; }
        public string Group { get; set; }
        public decimal SalesYTD { get; set; }
        public decimal SalesLastYear { get; set; }
        public decimal CostYTD { get; set; }
        public decimal CostLastYear { get; set; }
        public System.Guid rowguid { get; set; }
        public System.DateTime ModifiedDate { get; set; }
    }

    ///      /// The class which is used to provide the necessary information to draw chart     /// on the chart axis.     ///
    public partial class SalesInfo
    {
        public string Name { get; set; }
        public decimal Sales { get; set; }
    }

    ///      /// The class used to represent information for the CountryRegioCode     /// e.g. US, GB etc.     ///
    public class CountryRegionCode
    {
        public string CountryRegion { get; set; }
    }
}
In this code we just saw:
- The SalesTerritory class represents the entity for the sales information received from the WEB API.
- The SalesInfo class is used to provide the necessary information for drawing chart on the UI.
- The CountryRegionCode class is used to represent the CountryRegion information on the UI, so that on the selection of it by end-user, a chart can be drawn.
Step 10: In the project add a new folder with the name ‘Commands’ and add the following command class in it.
using System;
using System.Windows.Input;

namespace WPF_ModernChart_Client.Commands
{
    public class RelayCommand : ICommand
    {
        Action _handler;

        public RelayCommand(Action h)
        {
            _handler =  h;
        }

        public bool CanExecute(object parameter)
        {
            return true;
        }

        public event EventHandler CanExecuteChanged;

        public void Execute(object parameter)
        {
            _handler();
        }
    }
}
Step 11: To draw a Chart, logic is required for reading and manipulating the received data from WEB API and then using it in a proper format to draw chart on the UI. Since we are using the SalesTerritory table to read the data, the data for columns for SalesYTD and SalesLastYear will be used for displaying Charts and the column CountryRegionCode will be used based upon which the data will be grouped to display on chart.
Add a new folder with the name ‘ViewModelsRepository’ in the project and add a class file to it with the following code:
using System.Collections.ObjectModel;
using System.Linq;
using WPF_ModernChart_Client.HelperClasses;

using WPF_ModernChart_Client.ModelClasses;
using WPF_ModernChart_Client.ServiceAdapter;
using System.ComponentModel;
using WPF_ModernChart_Client.Commands;

namespace WPF_ModernChart_Client.ViewModelsRepository
{
    ///      /// The class contains:     /// 1. The ChartInfo collection property to display the available charts in the combobox.     /// 2. The SalesData collection property to use as a source for drawing charts in UI.     /// 3. The CountryRegion collection property to use as a source for the CountryRegion code for UI.     /// 4. The CountryRegionName property to use as a filter when the UI changes the CountryRegion to draw chart.     /// 5. The IsRadioButtonEnabled property for enabling and disabling the RadioButton on UI     /// 6. The SalesDetailsYTDCommand and SalesDetailsLastYearCommand command object to execute methods when action is taken on UI     /// 7. The GetYTDSalesDataByCountryRegion() and GetLastYearSalesDataByCountryRegion() method are     /// used to get the YTD and LastYEar sales data respectively based upon the CountryRegionCode selected on UI.     /// 8. The GetCountryRegionCodeGroup() method is used to provide information  about available CountryRegion code.     ///
    public class ChartsViewModel : INotifyPropertyChanged
    {
        ProxyAdapter adapter;

        ObservableCollection _ChartsInfo;          public ObservableCollection ChartsInfo         {             get { return _ChartsInfo; }             set { _ChartsInfo = value; }         }          ObservableCollection _SalesData;          public ObservableCollection SalesData         {             get { return _SalesData; }             set { _SalesData = value; }         }              ObservableCollection _CountryRegion;          public ObservableCollection CountryRegion         {             get { return _CountryRegion; }             set { _CountryRegion = value; }         }           CountryRegionCode _CountryRegionName;          public CountryRegionCode CountryRegionName         {             get { return _CountryRegionName; }             set             {                 _CountryRegionName = value;                 IsRadioButtonEnabled = true;                 onPropertyChanged("CountryRegionName");             }         }           bool _IsRadioButtonEnabled = false;          public bool IsRadioButtonEnabled         {             get { return _IsRadioButtonEnabled; }             set              {                 _IsRadioButtonEnabled = value;                 onPropertyChanged("IsRadioButtonEnabled");             }         }                    ChartTypeHelper helper;          public ChartsViewModel()         {             adapter = new ProxyAdapter();              helper = new ChartTypeHelper();              ChartsInfo = helper.GetChartNames();              SalesData = new ObservableCollection();             CountryRegion = new ObservableCollection();                           GetCountryRegionCodeGroup();               SalesDetailsYTDCommand = new RelayCommand(GetYTDSalesDataByCountryRegion);             SalesDetailsLastYearCommand = new RelayCommand(GetLastYearSalesDataByCountryRegion);         }          public RelayCommand SalesDetailsYTDCommand { get; set; }         public RelayCommand SalesDetailsLastYearCommand { get; set; }          ///          /// Method to get Sales Data for YTD based upon the CountryRegion code         ///          public async void GetYTDSalesDataByCountryRegion()         {             if (CountryRegionName!=null)             {              SalesData.Clear();             var Res = (from sale in await adapter.GetSalesInformation()                        where sale.CountryRegionCode == CountryRegionName.CountryRegion                        select new {                            Name = sale.Name,                           SaleYTD = sale.SalesYTD                        }).ToList();               foreach (var item in Res)              {                  SalesData.Add(new SalesInfo() { Name = item.Name, Sales = item.SaleYTD });              }             }         }           ///          /// Method to get Sales Data for Last Year based upon the CountryRegion code         ///          public async void GetLastYearSalesDataByCountryRegion()         {             if (CountryRegionName != null)             {              SalesData.Clear();             var Res = (from sale in await adapter.GetSalesInformation()                        where sale.CountryRegionCode == CountryRegionName.CountryRegion                        select new                        {                            Name = sale.Name,                            SalesLastYear = sale.SalesLastYear                        }).ToList();              foreach (var item in Res)             {                 SalesData.Add(new SalesInfo() { Name = item.Name, Sales = item.SalesLastYear });             }             }         }          ///          /// Method to Get the Country-Region Code         ///          public async void GetCountryRegionCodeGroup()         {              var Res = (from cr in await adapter.GetSalesInformation()                       group cr by cr.CountryRegionCode into crg                       select new CountryRegionCode()                       {                           CountryRegion = crg.Key                       });             foreach (var item in Res.ToList())             {                 CountryRegion.Add(item);             }         }          public event PropertyChangedEventHandler PropertyChanged;          void onPropertyChanged(string pName)         {             if (PropertyChanged != null)             {                 PropertyChanged(this,new PropertyChangedEventArgs(pName));             }         }     } }
The code we just saw has the following specifications:
- The ChartInfo collection property is used to display the available charts in the combobox.
- The SalesData collection property is used as a source for drawing charts in UI.
- The CountryRegion collection property is used as a source for the CountryRegion code for UI.
- The CountryRegionName property is used as a filter when the UI changes the CountryRegion to draw chart.
- The IsRadioButtonEnabled property for enabling and disabling the RadioButton on the UI
- The SalesDetailsYTDCommand and SalesDetailsLastYearCommand command object to execute methods when action is taken on UI
- The GetYTDSalesDataByCountryRegion() and GetLastYearSalesDataByCountryRegion () method are used to get the YTD and LastYear sales data respectively based upon the CountryRegionCode selected on UI.
- The GetCountryRegionCodeGroup () method is used to provide information about the available CountryRegion code.
Step 12: In the Project, add a new folder with the name ‘ChartControls’. This folder will also contain some WPF UserControls. Each UserControl will contain the different chart types from the ModernUI Chart library. Add a new WPF User control in the project and name it as ‘ClusteredBarChartUserControl’. Define the User Control as following:
In the above XAML, the ModernUI Chart library is highlighted. The XAML defines properties set for the ‘ClusteredBarChart’. The ChartSeries defines the data source for drawing chart using the ‘ItemsSource’ property. The DisplayMemberName property displays the Textual data on the chart axis and ValueMember property is used to display values on chart axis.
Follow Step 12 to create user controls for the following chart types:
- PieChart
- ClusteredColumnChart
- ClusteredBarChart
- DoughnutChart
- StackedColumnChart
- StackedBarChart
- RadialGaugeChart
Step 13: Open MainWindow.xaml and add the following XAML markup in it:
This XAML will produce the following output:
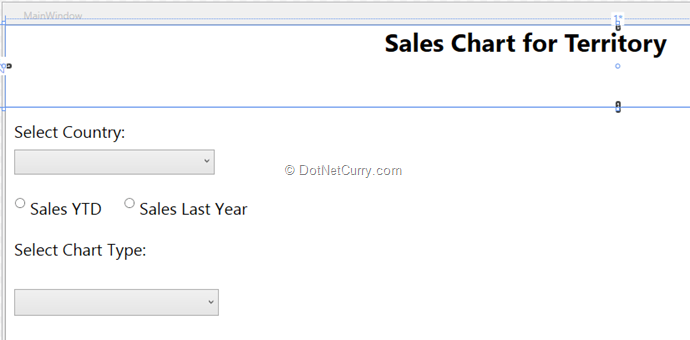
Figure 6: Sales Chart UI
The ComboBox ‘lstcharttype’ displays all the available chart types. The ComboBox ‘lstCountryRegionCode’ is used to display all the country regions in it so that end-user can select it to draw a chart. Both ComboBoxes are initially set to the default selected index to ‘0’. The Grid with the name ‘grdChartContainer’ (not seen in the UI) will be used as a container to the UserControl for displaying chart types as defined in Step 12. The Grid is bound with the SalesData property declared in the ViewModel class, using DataContext property of the Grid. This property will then be passed to each user control for drawing chart. Both radio buttons are set with the Command property declared in the ViewModel class.
Step 14: Add the following code in the code-behind of the MainWindow.xaml:
public partial class MainWindow : Window
    {

        ChartsViewModel vm;


        ///          /// The Constructor set the DataContext of the Window to an object of the ViewModel class.         ///
        public MainWindow()
        {
            InitializeComponent();
            vm = new ChartsViewModel();
            this.DataContext = vm;
        }


        ///          /// The method gets executed when the chart is selected from the ComboBox.         /// The method adds the UserControl in the Grid with the name grdChartContainer based upon the chart name selected from the ComboBox.         ///
        ///
        ///
        private void lstcharttype_SelectionChanged(object sender, SelectionChangedEventArgs e)
        {
            grdChartContainer.Children.Clear();


            var chartType = lstcharttype.SelectedItem as ChartNameStore;

            switch (chartType.Name)
            {
                case "PieChart":
                    PieChartUserControl pie = new PieChartUserControl();
                    pie.DataContext = grdChartContainer.DataContext;
                    grdChartContainer.Children.Add(pie);
                    break;
                case "ClusteredColumnChart":
                    ClusteredColumnChartUserControl ccchart = new ClusteredColumnChartUserControl();
                    ccchart.DataContext = grdChartContainer.DataContext;
                    grdChartContainer.Children.Add(ccchart);
                    break;
                case "ClusteredBarChart":
                    ClusteredBarChartUserControl cbchart = new ClusteredBarChartUserControl();
                    cbchart.DataContext = grdChartContainer.DataContext;
                    grdChartContainer.Children.Add(cbchart);
                    break;
                case "DoughnutChart":
                    DoughnutChartUserControl dnchart = new DoughnutChartUserControl();
                    dnchart.DataContext = grdChartContainer.DataContext;
                    grdChartContainer.Children.Add(dnchart);
                    break;
                case "StackedColumnChart":
                    StackedColumnChartUserControl stcchart = new StackedColumnChartUserControl();
                    stcchart.DataContext = grdChartContainer.DataContext;
                    grdChartContainer.Children.Add(stcchart);
                    break;
                case "StackedBarChart":
                    StackedBarChartUserControl stbchart = new StackedBarChartUserControl();
                    stbchart.DataContext = grdChartContainer.DataContext;
                    grdChartContainer.Children.Add(stbchart);
                    break;
                case "RadialGaugeChart":
                    RadialGaugeChartUserControl rgchart = new RadialGaugeChartUserControl();
                    rgchart.DataContext = grdChartContainer.DataContext;
                    grdChartContainer.Children.Add(rgchart);
                    break;
            }

        }
    }
The code we just saw defines an object of the ViewModel class. This object is assigned to the DataContext property of the MainWindow so that all public properties defined in the ViewModel class can be bound with the UI in XAML. The lstcharttype_SelectionChanged method is executed when the chart is selected from the lstcharttype combobox. This methods then adds the Chart UserControl in the grid grdChartContainer.
Step 15: Run the application and you should see the following:
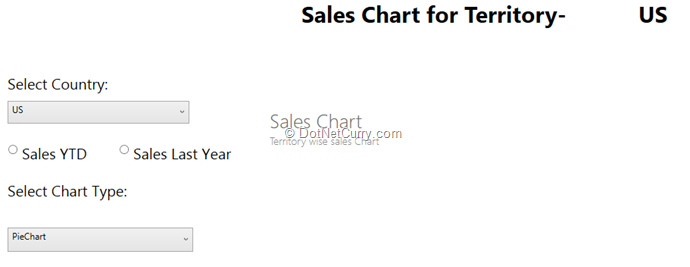
Figure 7: Sales Chart for US
The default values for the Country Region is selected as ‘US’ (United States).
Pie Chart
The default Chart type selected is ‘PieChart’. Select the Radio Button ‘Sales YTD’ or ‘Sales Last Year’ and the result will change as seen in Figure 8:

Figure 8: Sales YTD or Sales Last Year
Now change the chart type and see how the graphical representation changes:
Radial Gauge Chart
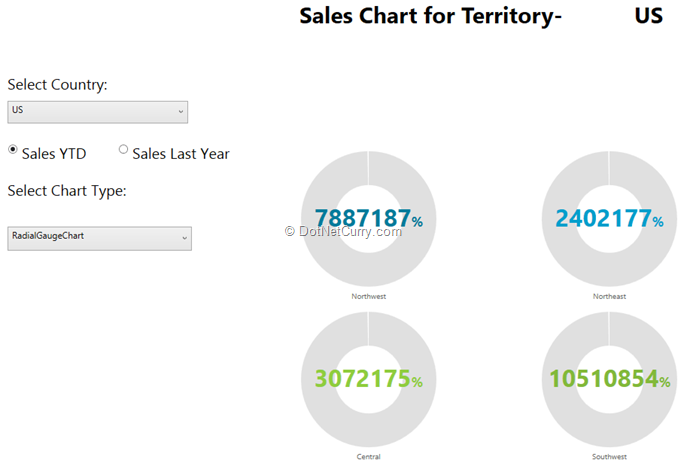
Figure 9: Radial Gauge Chart
Similarly all the other chart types can be tested by selecting the respective Chart type from the ‘Select Chart Type’ dropdown.
Clustered Column Chart

Figure 10: Clustered Column Chart
Clustered Bar Chart

Figure 11: Clustered Bar Chart
Doughnut Chart
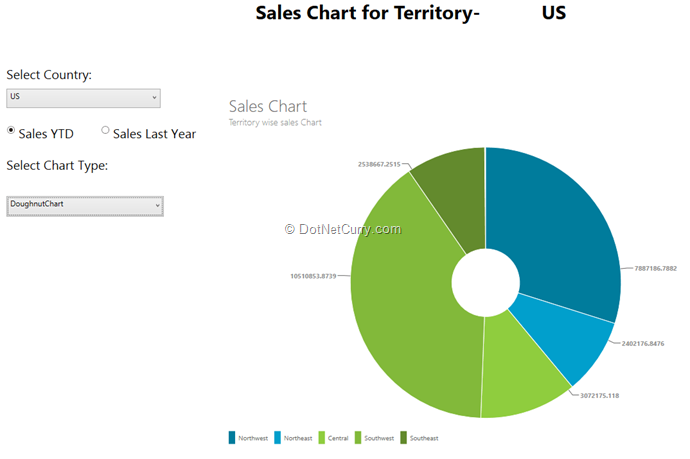
Figure 12: Doughnut Chart
Stacked Column Chart

Figure 13: Stacked Column Chart
Stacked Bar Chart

Figure 14: Stacked Bar Chart
Conclusion: WPF has a rich charting and graphical capability, however it is time-consuming to build your own charts from groundup. The ModernUI chart library is a free handy library which allows you to quickly display some statistical data in a graphical form instead of creating your own chart using WPF 2-D APIs or relying on a 3rd party graphic package.
Download the entire source code from our GitHub Repository at bit.ly/dncm13-modernuicharts
This article has been editorially reviewed by Suprotim Agarwal.
C# and .NET have been around for a very long time, but their constant growth means there’s always more to learn.
We at DotNetCurry are very excited to announce The Absolutely Awesome Book on C# and .NET. This is a 500 pages concise technical eBook available in PDF, ePub (iPad), and Mobi (Kindle).
Organized around concepts, this Book aims to provide a concise, yet solid foundation in C# and .NET, covering C# 6.0, C# 7.0 and .NET Core, with chapters on the latest .NET Core 3.0, .NET Standard and C# 8.0 (final release) too. Use these concepts to deepen your existing knowledge of C# and .NET, to have a solid grasp of the latest in C# and .NET OR to crack your next .NET Interview.
Click here to Explore the Table of Contents or Download Sample Chapters!
Was this article worth reading? Share it with fellow developers too. Thanks!
Mahesh Sabnis is a DotNetCurry author and a Microsoft MVP having over two decades of experience in IT education and development. He is a Microsoft Certified Trainer (MCT) since 2005 and has conducted various Corporate Training programs for .NET Technologies (all versions), and Front-end technologies like Angular and React. Follow him on twitter @
maheshdotnet or connect with him on
LinkedIn