Visual Studio 2015 is finally delivering the results of project Roslyn – an ambitious attempt at rewriting the C# and Visual Basic compilers as a service. One of the benefits is the support for diagnostic analyzers in the code editor. They are small pieces of code for validating and refactoring different aspects of source code, which can easily be written by any developer wanting to improve his development experience in Visual Studio.
This article will help you learn everything you need to know about diagnostic analyzers, and hopefully convince you that for your everyday development, you need to start using them as soon as you switch to Visual Studio 2015.
You can download the Free Visual Studio 2015 Community Edition if you haven’t already.
Improvements in the Code Editor
Visual Studio code editor has always performed background static code analysis to provide developers with information about errors and warnings in code. Instead of having to build the project and finding these errors and warnings in compiler output, they can be visualized directly in the source code, using squiggly lines below the offending code.

Image 1: Error visualization in earlier versions of Visual Studio
The functionality is still present in Visual Studio 2015, but it has been completely rewritten to take advantage of the new .NET Compiler Platform (formerly known as project Roslyn). Instead of the code editor parsing the code itself, it can now use the intermediate results of the actual C# (or Visual Basic) compiler, which is silently running in the background, compiling the code as the developer is changing it. The information obtained this way is more detailed and accurate, compared to what the code editor could produce.
This article is published from the DNC Magazine for .NET Developers and Architects. Download this magazine from here [Zip PDF] or Subscribe to this magazine for FREE and download all previous and current editions
Rewriting the Code editor introduced another improvement which is much easier to notice: redesigned user interface. This improvement is strongly influenced by JetBrains ReSharper and other third party Visual Studio extensions. All available actions for refactoring the affected code and fixing it, are now grouped together in a dropdown menu accessible via the lightbulb icon. Upon selecting the menu item for the selected refactoring, a preview is shown with all the changes, which is then applied to the code. This makes refactoring much safer and more inviting to use.
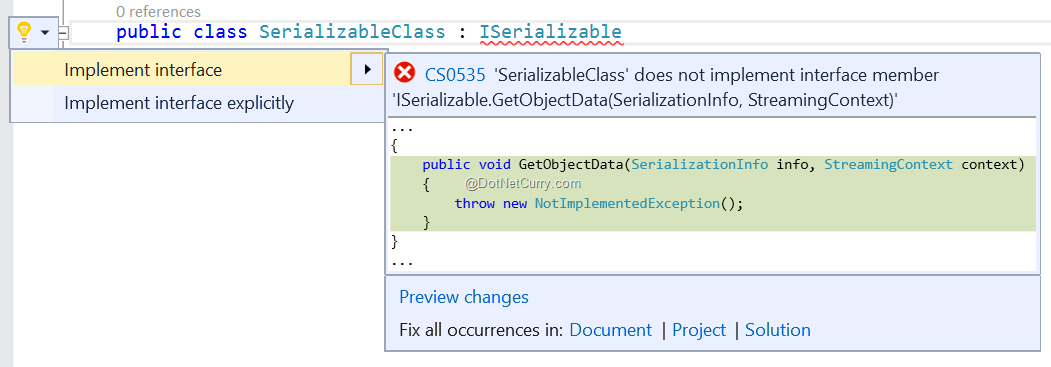
Image 2: Preview window with code changes
Adding Diagnostic Analyzers to a Project
With the new code editor, it is now possible to extend the built-in static code analysis on a per-project basis. To install a so-called diagnostic analyzer into a project, NuGet package manager is used. To open the NuGet window, right click on the project in Solution Explorer and select Manage NuGet Packages… from the context menu. Visual Studio 2015 includes NuGet 3, which opens a dockable window instead of a modal dialog, as was the case in the previous version.
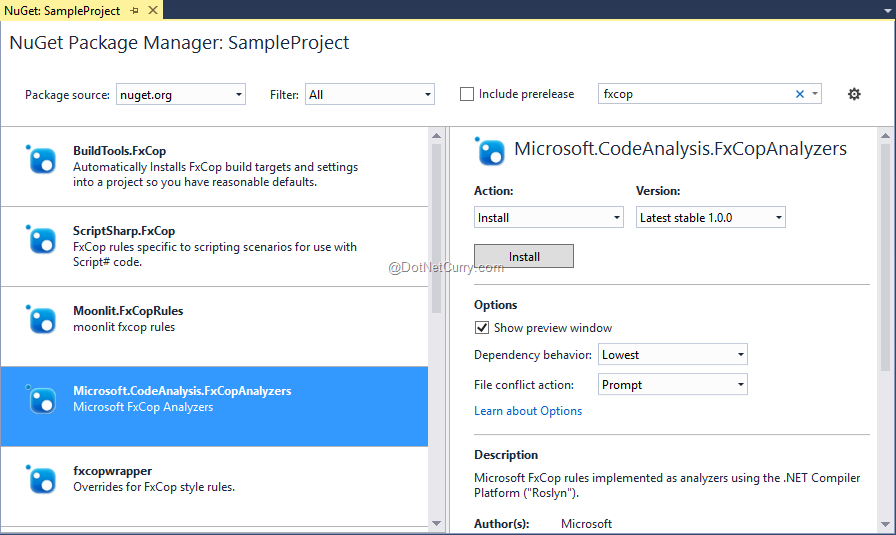
Image 3: NuGet window for managing packages
Unfortunately, at the time of this writing, there is no way to distinguish between packages containing diagnostic analyzers and ordinary libraries, which makes it impossible to browse through all currently available diagnostic analyzers. To test how they work, we will install a set of diagnostic analyzers, published by Microsoft: Microsoft.CodeAnalysis.FxCopAnalyzers. It is a reimplementation of some of the rules that were previously only available in a standalone tool, named FxCop, designed for checking conformance with the .NET framework design guidelines. To install the package into the current project, search for it in the official package source, select it in the list view, and click Install. After confirming two NuGet dialogs, the analyzers will get installed.
External Diagnostic Analyzers in Action
To see them in action, create a new class in your project containing the following code:
using System;
using System.Runtime.Serialization;

namespace ClassLibrary3
{
    public class SerializableClass : ISerializable
    {
        public void GetObjectData(SerializationInfo info, StreamingContext context)
        {
            throw new NotImplementedException();
        }
    }
}
Before the package was installed, there were no errors or warnings in this code. Immediately after the installation, SerializableClass became underlined with a green squiggly line indicating a warning. If you click on the lightbulb icon, you will notice a new suggestion for fixing the code.

Image 4: Diagnostic analyzer suggesting a code fix
The behavior is the same as with built-in defects in all aspects, making it almost impossible to distinguish between them. The action is included in the same dropdown menu and it includes a preview of the change. There is even a hyperlink on the rule id (CA2337), which opens the corresponding help page, if you click on it. The warning is also displayed in Visual Studio’s standard Error List. All of this is available to anyone developing a new diagnostic analyzer, not only to internal Microsoft developers.

Configuring the Behavior of Diagnostic Analyzers in the Project
It is time to take a closer look at what happened when we installed the FxCop diagnostic analyzers into the project. As with all the other NuGet packages, the correct location is the project’s References node in the Solution Explorer window. Inside it is a new sub-node called Analyzers, which contains all the analyzers installed with our package. The rules are grouped by their assembly; each one of them having an icon in front, representing its severity: Error, Warning, Info, Hidden, or None.
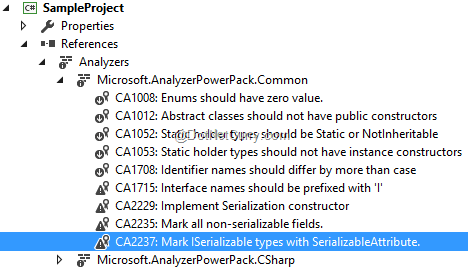
Image 6: Analyzers in Solution Explorer window
When the package is first installed, all its rules have their default severity set. This can easily be changed for each individual project by right clicking on the rule item in the Solution Explorer window and checking the desired severity from the Set Rule Set Severity sub-menu of the context menu. Of course, this will also change the icon in front of that rule accordingly.
As soon as you change the severity of any rule, a new file is saved in the project folder: <ProjectName>.ruleset. Inside it, the severity for each of the enabled rules is stored. Once created, the file will also be added to the project root in the Solution Explorer. By double clicking it, you can open a dedicated editor for it, which makes it easier to enable/disable the rules and set their severity. For the selected rule, the editor also shows the online help page if it exists, providing a more detailed explanation which might be useful when the rule name is not clear enough. In contrast to the Analyzers node in the Solution Explorer window, the editor additionally allows configuration of Visual Studio’s built-in rules.
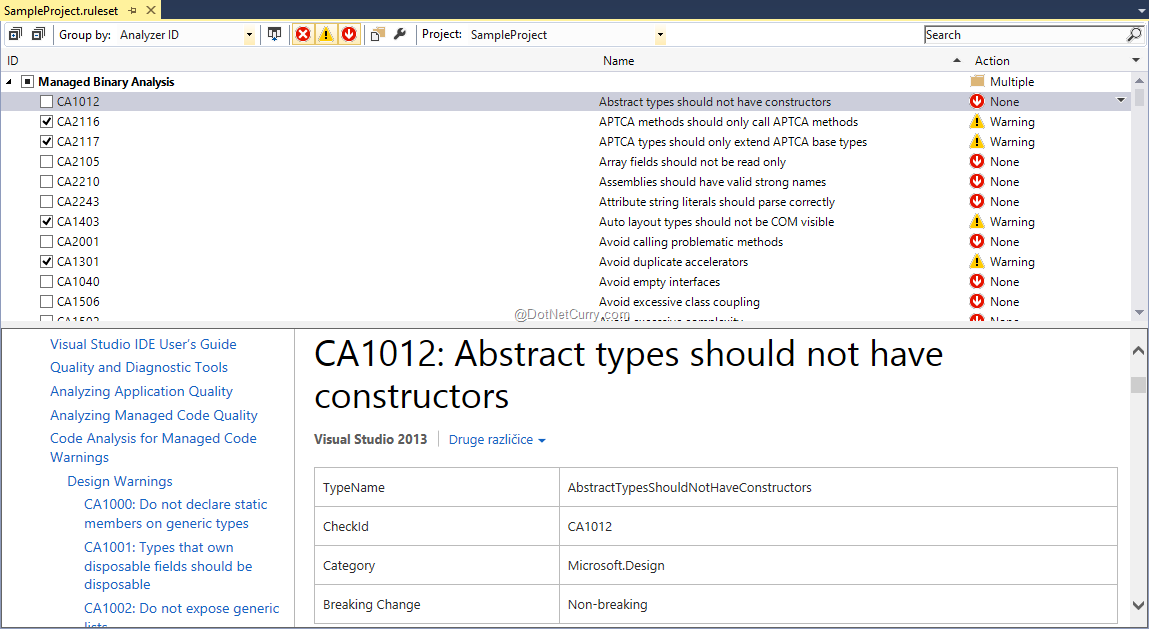
Image 7: Ruleset editor window with online help
In a collaborative environment, make sure you commit the ruleset file to source control along with the project file. The former contains rule severity settings, the latter a list of referenced analyzer assemblies. Both together will make sure that all developers, and the build server, will have the same configuration. As always, you should not put the packages folder into source control – the required assemblies will automatically be downloaded as part of the package restore operation when you attempt to build the project.
A Different Way of Installing Diagnostic Analyzers
Diagnostic analyzers are not necessarily distributed only as NuGet packages; they can also be available as Visual Studio extensions (VSIX files). These are listed in the Visual Studio Gallery and can be installed from the Extensions and Updates window in Visual Studio.
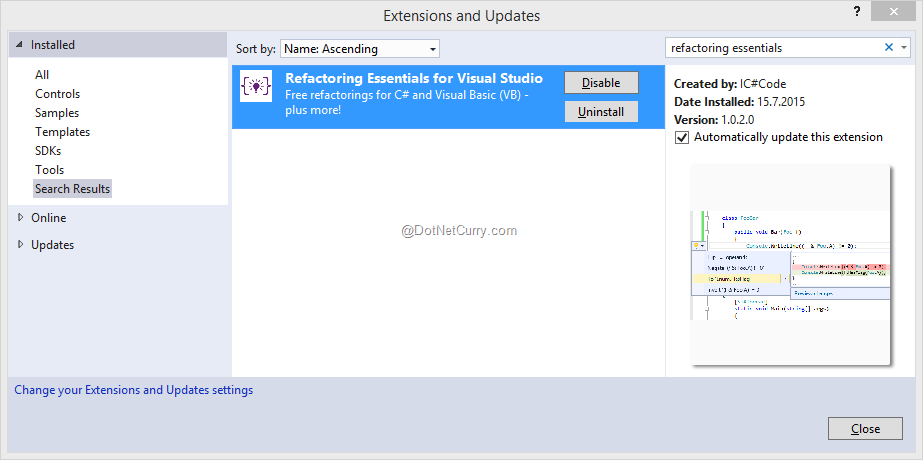
Image 8: Refactoring Essentials extension installed in Visual Studio
Analyzers and rules included from Visual Studio extensions will not be visible in the Solution Explorer; instead they will appear in the ruleset editor window. If you do not yet have a ruleset file in the project, it can be a bit tricky to open this window. You need to right click the empty Analyzers node in the Solution Explorer, and select the Open Active Rule Set from the context menu. This will open the default configuration, but as soon as you make your first change, the ruleset file will be created, just like when you first edited the rules in the Solution Explorer tree view.
Still, installing diagnostic analyzers as extensions does not work as well as when you are using NuGet packages. Although the rules are configured in the ruleset file, they are silently ignored when a developer does not have the same extension installed. This makes it impossible to strictly enforce the rule validation for the entire development team. In my opinion, diagnostic analyzers installed as extensions are only valuable during their development process, because this makes it easy to debug them from a second Visual Studio instance.
Since the final version of Visual Studio 2015 has just been released, it is still too early to expect a well-developed ecosystem of third party diagnostic analyzers. Nevertheless, some are already available, showing what we can expect in future.
The rules they are providing can be categorized into groups, based on the type of analysis they are doing:
- Validation of best practices for using APIs: e.g. gotchas to be aware of when developing for Microsoft Azure.
- Validation of other languages embedded as string literals: e.g. regular expression or SQL validation.
- Enforcing of design guidelines: most of FxCop rules belong here.
- Enforcing of style guidelines: naming policies, code formatting, preferred language features, etc.
Since there is no centralized directory of available diagnostic analyzers yet, it is difficult to know about all of them. Apart from the previously mentioned Microsoft.CodeAnalysis.FxCopAnalyzers and Refactoring Essentials, most of the other analyzers are less mature and they mostly seem to be created out of interest for learning or sample projects.
Conclusion:
Visual Studio 2015 is a much larger step forward in comparison to the previous versions – the main reason being the inclusion of Roslyn. Diagnostic analyzers might be the most important single addition to Visual Studio as a side product of that change.
I believe diagnostic analyzers can strongly affect the way we will be writing code, if they gain the traction they deserve.
In my opinion, the most valuable of them could be diagnostic analyzers for popular third party libraries, helping us write the code as it was meant to; assuming enough of them will be developed. The second important group will be rules for enforcing design and style guidelines. This field is currently covered with a couple of high profile Visual Studio extensions. Diagnostic analyzers from smaller developers could reinvigorate the innovation in this field.
The final important change could happen in large development teams with extensive internal codebase and strict coding standards. By configuring their rulesets and developing additional diagnostic analyzers for their own specific requirements, enforcing the rules that are already in place could become much more efficient and effective.
It will be interesting to see, where we end up in a year or two. In any case, do not wait that long before you try out diagnostic analyzers. It will be worth your time!
Update: The 2nd part of this article can be viewed at Create Your First Diagnostic Analyzer in Visual Studio 2015.
This article has been editorially reviewed by Suprotim Agarwal.
C# and .NET have been around for a very long time, but their constant growth means there’s always more to learn.
We at DotNetCurry are very excited to announce The Absolutely Awesome Book on C# and .NET. This is a 500 pages concise technical eBook available in PDF, ePub (iPad), and Mobi (Kindle).
Organized around concepts, this Book aims to provide a concise, yet solid foundation in C# and .NET, covering C# 6.0, C# 7.0 and .NET Core, with chapters on the latest .NET Core 3.0, .NET Standard and C# 8.0 (final release) too. Use these concepts to deepen your existing knowledge of C# and .NET, to have a solid grasp of the latest in C# and .NET OR to crack your next .NET Interview.
Click here to Explore the Table of Contents or Download Sample Chapters!
Was this article worth reading? Share it with fellow developers too. Thanks!
Damir Arh has many years of experience with software development and maintenance; from complex enterprise software projects to modern consumer-oriented mobile applications. Although he has worked with a wide spectrum of different languages, his favorite language remains C#. In his drive towards better development processes, he is a proponent of Test-driven development, Continuous Integration, and Continuous Deployment. He shares his knowledge by speaking at local user groups and conferences, blogging, and writing articles. He is an awarded Microsoft MVP for .NET since 2012.